> ## Documentation Index
> Fetch the complete documentation index at: https://docs.requestly.com/llms.txt
> Use this file to discover all available pages before exploring further.
# DevTools
> Inspect script logs, network activity, and cookies from your API requests in a single panel inside the Requestly API Client.
DevTools is Requestly's built-in debugger for API requests. It captures console output from your pre and post-request scripts, every outgoing request and its matching response, and the cookies attached to each call. Use it the same way you would use the browser's DevTools, but for the requests you fire from inside Requestly.
## Open DevTools
There are two ways to open DevTools, depending on whether you want to see activity across the whole app or scope it to a single request.
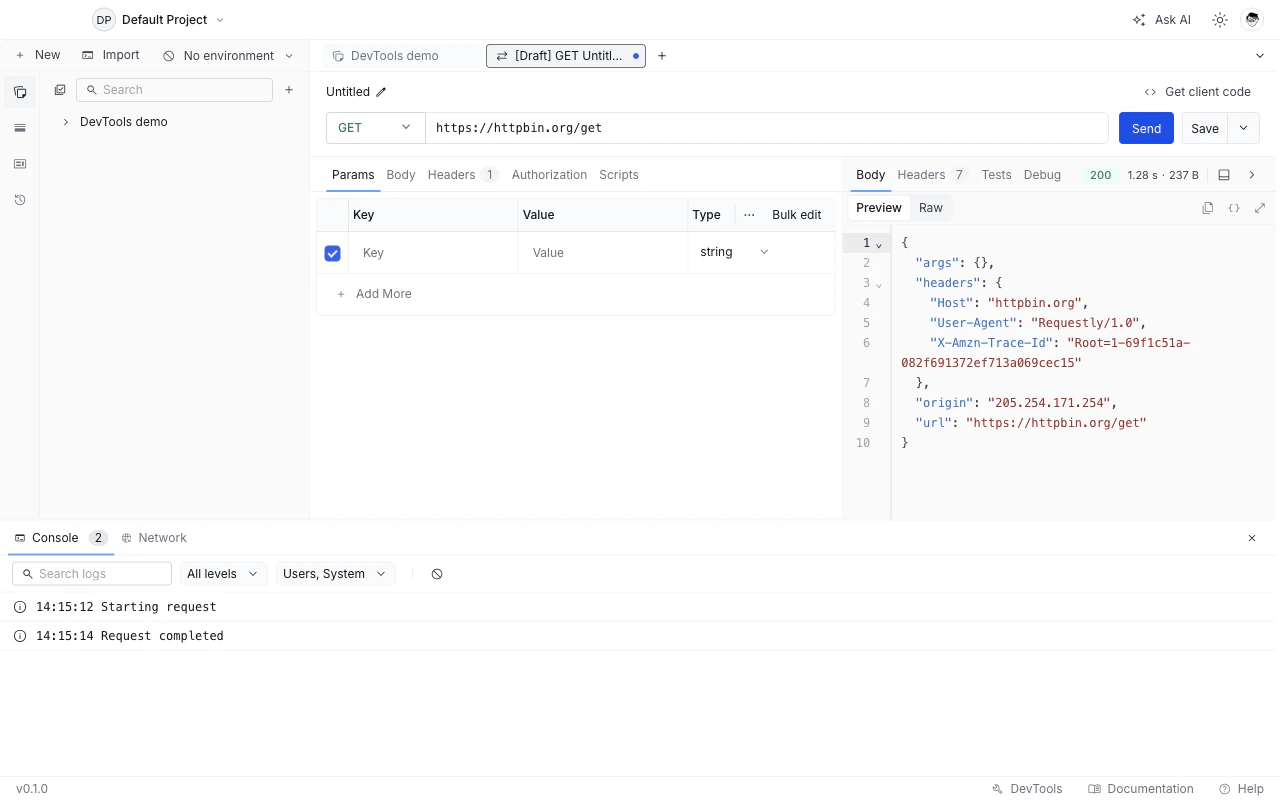
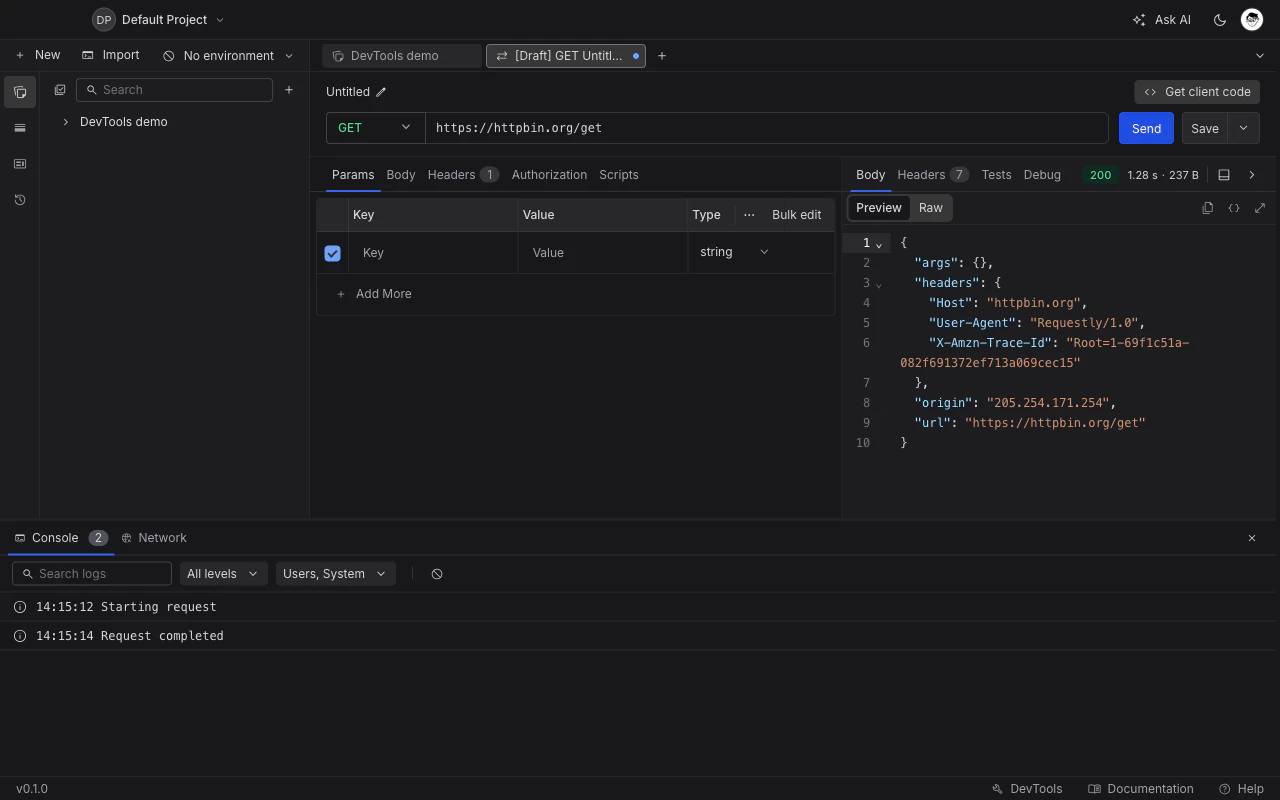 Click the **DevTools** button in the application footer at the bottom of the window. The panel docks to the bottom of the workspace and shows everything that has happened in the current session: every script log, every network request, and every cookie set or sent. Click the **X** in the top-right of the panel to close it.
Use this when you want a session-wide view, for example to compare two recent requests or scan logs from a script that ran across several calls.
Open any HTTP request and send it. In the response area you will see a **Debug** tab next to **Body**, **Headers**, and **Test Results**. The Debug tab shows DevTools scoped to that one request's most recent execution.
Use this when you want to inspect what a single request did without scrolling through unrelated activity. It is the fastest path from "this request misbehaved" to "here is the log line that explains why."
## Console tab
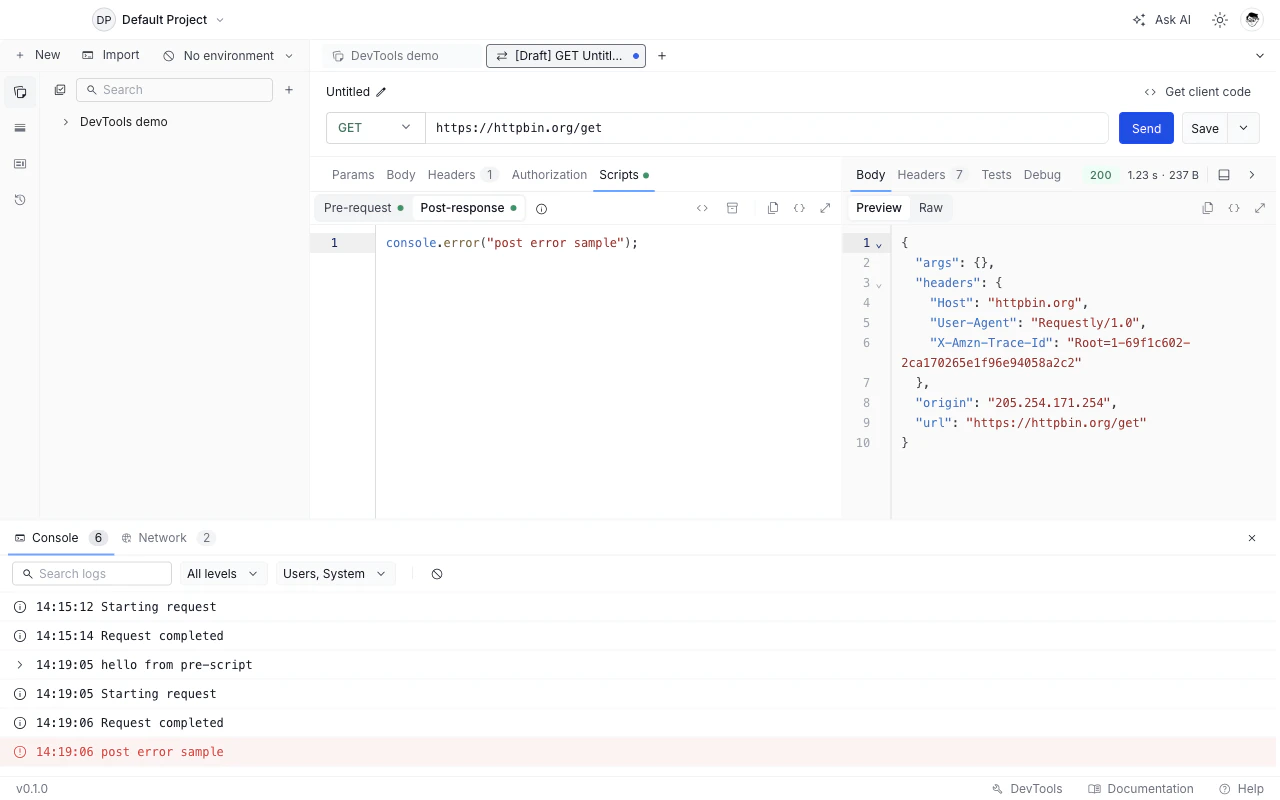
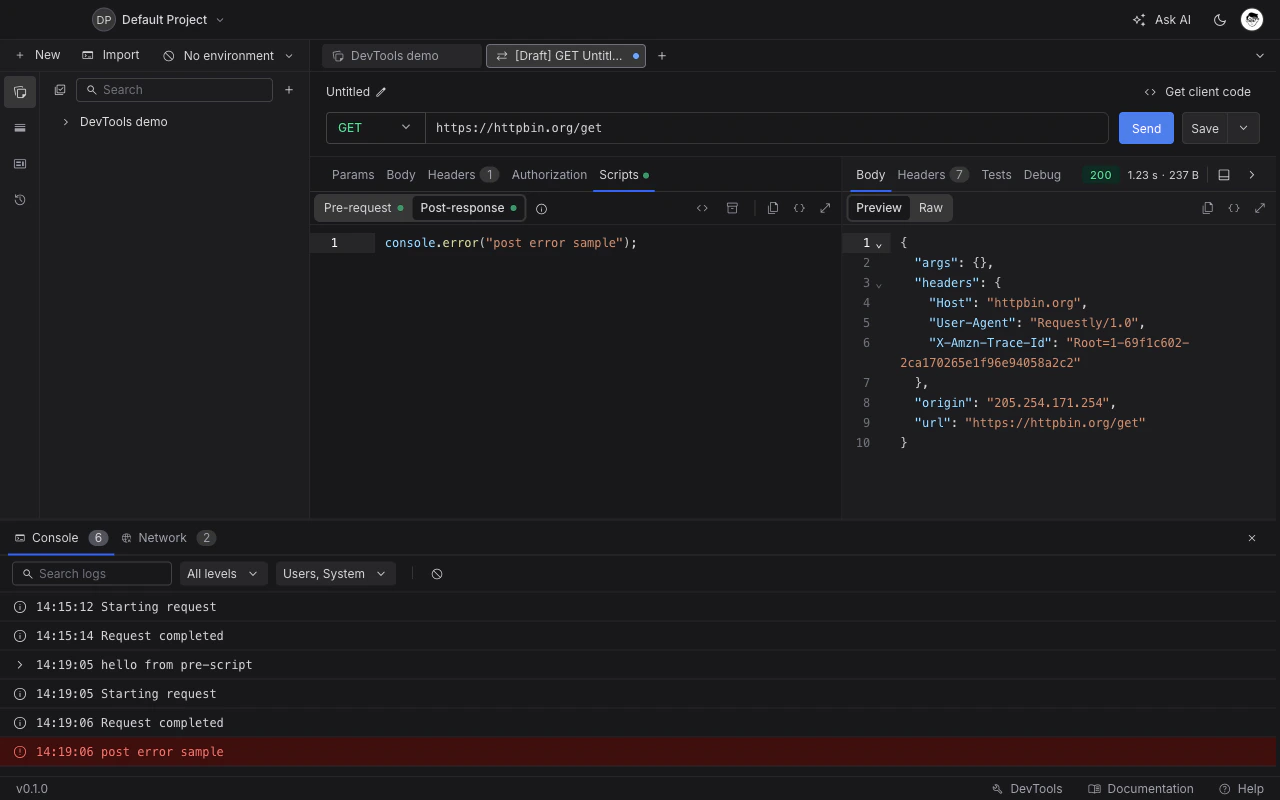
The Console shows log output produced while a request runs. That includes anything you wrote with `console.log()` or `console.error()` in a pre or post-request script, plus system events Requestly emits (for example, when a script throws an error).
Click the **DevTools** button in the application footer at the bottom of the window. The panel docks to the bottom of the workspace and shows everything that has happened in the current session: every script log, every network request, and every cookie set or sent. Click the **X** in the top-right of the panel to close it.
Use this when you want a session-wide view, for example to compare two recent requests or scan logs from a script that ran across several calls.
Open any HTTP request and send it. In the response area you will see a **Debug** tab next to **Body**, **Headers**, and **Test Results**. The Debug tab shows DevTools scoped to that one request's most recent execution.
Use this when you want to inspect what a single request did without scrolling through unrelated activity. It is the fastest path from "this request misbehaved" to "here is the log line that explains why."
## Console tab
The Console shows log output produced while a request runs. That includes anything you wrote with `console.log()` or `console.error()` in a pre or post-request script, plus system events Requestly emits (for example, when a script throws an error).
 The toolbar at the top of the panel gives you four controls:
* **Search**. Filters the visible log lines by substring match. Useful when you want to find a specific value you logged.
* **Level filter**. Toggle **Info**, **Warnings**, and **Errors**. By default all three are on. Turn off a level to hide those entries.
* **Source filter**. Toggle between **Users** (logs your scripts produced), **System** (errors and lifecycle events from Requestly itself), and **Network requests** (one-line summaries of each request the runtime made). All three are on by default.
* **Clear**. Empties the panel. Note that clear wipes both the Console and Network tabs at once, since they share a single store.
Logs from your pre and post-request scripts are tagged so you can find them quickly. Type `#script` into the search box to show only your own log output and hide everything else.
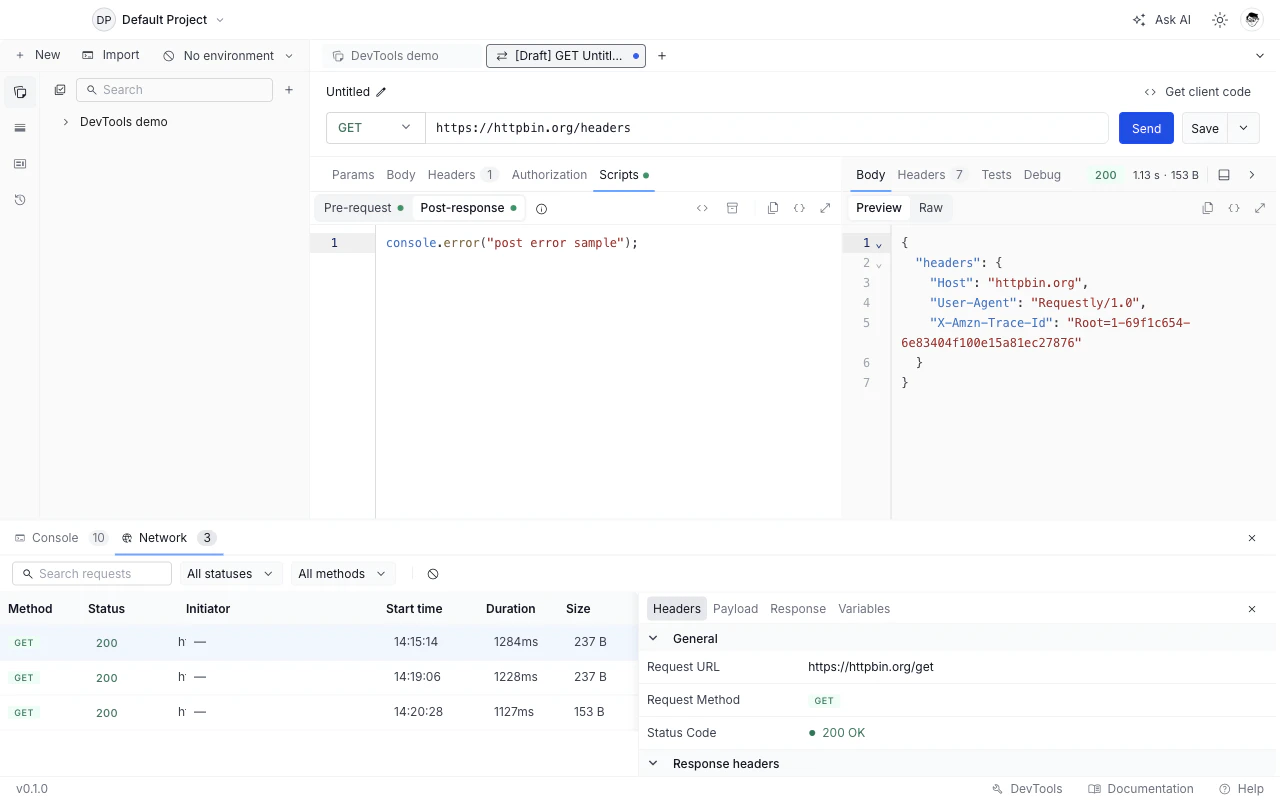
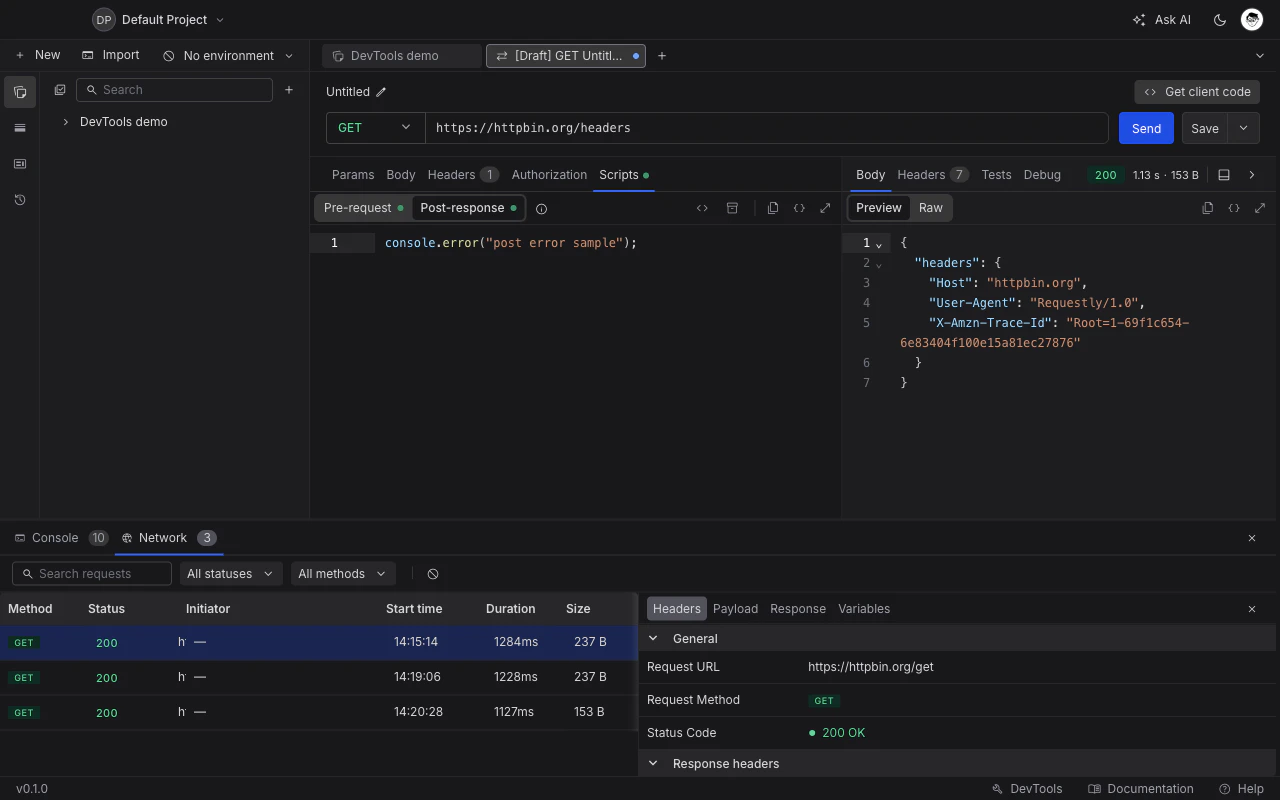
## Network tab
The Network tab lists every request the runtime sent on your behalf, including requests fired by `rq.sendRequest` from inside scripts and requests made by the collection runner. Each row shows the method, status code, URL, timestamp, response time, and response size.
The toolbar at the top of the panel gives you four controls:
* **Search**. Filters the visible log lines by substring match. Useful when you want to find a specific value you logged.
* **Level filter**. Toggle **Info**, **Warnings**, and **Errors**. By default all three are on. Turn off a level to hide those entries.
* **Source filter**. Toggle between **Users** (logs your scripts produced), **System** (errors and lifecycle events from Requestly itself), and **Network requests** (one-line summaries of each request the runtime made). All three are on by default.
* **Clear**. Empties the panel. Note that clear wipes both the Console and Network tabs at once, since they share a single store.
Logs from your pre and post-request scripts are tagged so you can find them quickly. Type `#script` into the search box to show only your own log output and hide everything else.
## Network tab
The Network tab lists every request the runtime sent on your behalf, including requests fired by `rq.sendRequest` from inside scripts and requests made by the collection runner. Each row shows the method, status code, URL, timestamp, response time, and response size.
 ### Filter the request list
The toolbar at the top of the panel offers three filters:
* **Search**. Matches against the URL, so you can locate a specific endpoint without scrolling.
* **Status**. Multi-select: **2xx Success**, **3xx Redirect**, **4xx Client Error**, **5xx Server Error**, and **No status (failed)**. The last option captures requests that never received a response, for example because of a network error or DNS failure.
* **Method**. Multi-select: GET, POST, PUT, PATCH, DELETE, OPTIONS, HEAD.
Filters combine with AND. A request shows up only if it matches the search text AND the active status set AND the active method set.
### Inspect a single request
Click any row in the list to open a side panel with detail tabs:
* **Headers**. Request and response headers, side by side.
* **Payload**. Query string, path parameters, and request body. Multipart and form-encoded bodies are decoded so you can read each field.
* **Response**. The response body rendered in the response viewer. JSON and XML are pretty-printed and syntax-highlighted, with collapsible sections. Image responses render as the actual picture, and other binary responses show a **Binary response** placeholder with the response size instead of unreadable characters.
* **Info**. TLS handshake details for HTTPS requests: the TLS version and cipher suite, the server certificate (subject, issuer, and expiry), and the client certificate that was sent, if any. This tab only appears for HTTPS requests. See [SSL Certificates](/api-client/send-api-request/ssl-certificates) for how to configure custom CA and client certificates.
* **Cookies**. The cookies attached to the request and any cookies set by the response. Only appears when at least one cookie is involved. See [Cookies](/api-client/send-api-request/cookies) for how the cookie jar works end-to-end.
* **Variables**. Every variable that was referenced anywhere in the request, with the scope it resolved from (environment, collection, runtime, or global) and the value it resolved to.
Headers and Payload have a **Show resolved values** toggle in the top-right. With it off, you see your request as you wrote it, including `{{variable}}` placeholders. With it on, you see the exact bytes that went over the wire after every variable was substituted. Flip the toggle when a request is failing and you suspect a variable resolved to the wrong value.
## Retention
DevTools keeps the most recent activity in memory and drops older entries once the panel fills up. The defaults are tuned to hold a long debugging session without slowing the app down:
* Up to **25,000** console log lines.
* Up to **10,000** network requests.
* Up to **5,000** system events and **5,000** cookies.
Once a category is full, the oldest entries fall off as new ones come in. Activity is cleared when you reload the app, so if you want to keep a log around, copy it before closing.
## What's Next?
Write JavaScript that runs around your requests and shows up in the Console
Assert on response data and watch the results in the Test Results tab
Manage the cookie jar that DevTools observes on every request
### Filter the request list
The toolbar at the top of the panel offers three filters:
* **Search**. Matches against the URL, so you can locate a specific endpoint without scrolling.
* **Status**. Multi-select: **2xx Success**, **3xx Redirect**, **4xx Client Error**, **5xx Server Error**, and **No status (failed)**. The last option captures requests that never received a response, for example because of a network error or DNS failure.
* **Method**. Multi-select: GET, POST, PUT, PATCH, DELETE, OPTIONS, HEAD.
Filters combine with AND. A request shows up only if it matches the search text AND the active status set AND the active method set.
### Inspect a single request
Click any row in the list to open a side panel with detail tabs:
* **Headers**. Request and response headers, side by side.
* **Payload**. Query string, path parameters, and request body. Multipart and form-encoded bodies are decoded so you can read each field.
* **Response**. The response body rendered in the response viewer. JSON and XML are pretty-printed and syntax-highlighted, with collapsible sections. Image responses render as the actual picture, and other binary responses show a **Binary response** placeholder with the response size instead of unreadable characters.
* **Info**. TLS handshake details for HTTPS requests: the TLS version and cipher suite, the server certificate (subject, issuer, and expiry), and the client certificate that was sent, if any. This tab only appears for HTTPS requests. See [SSL Certificates](/api-client/send-api-request/ssl-certificates) for how to configure custom CA and client certificates.
* **Cookies**. The cookies attached to the request and any cookies set by the response. Only appears when at least one cookie is involved. See [Cookies](/api-client/send-api-request/cookies) for how the cookie jar works end-to-end.
* **Variables**. Every variable that was referenced anywhere in the request, with the scope it resolved from (environment, collection, runtime, or global) and the value it resolved to.
Headers and Payload have a **Show resolved values** toggle in the top-right. With it off, you see your request as you wrote it, including `{{variable}}` placeholders. With it on, you see the exact bytes that went over the wire after every variable was substituted. Flip the toggle when a request is failing and you suspect a variable resolved to the wrong value.
## Retention
DevTools keeps the most recent activity in memory and drops older entries once the panel fills up. The defaults are tuned to hold a long debugging session without slowing the app down:
* Up to **25,000** console log lines.
* Up to **10,000** network requests.
* Up to **5,000** system events and **5,000** cookies.
Once a category is full, the oldest entries fall off as new ones come in. Activity is cleared when you reload the app, so if you want to keep a log around, copy it before closing.
## What's Next?
Write JavaScript that runs around your requests and shows up in the Console
Assert on response data and watch the results in the Test Results tab
Manage the cookie jar that DevTools observes on every request