> ## Documentation Index
> Fetch the complete documentation index at: https://docs.requestly.com/llms.txt
> Use this file to discover all available pages before exploring further.
# rq.visualizer (Response visualization)
> Render a custom visualization of an API response - charts, tables, or formatted HTML - from a pre-request or post-response script with rq.visualizer.set().
The `rq.visualizer` namespace lets your scripts render a custom view of your response: a chart, a table, or any formatted HTML, shown right beside the raw body. You give it a Handlebars template and some JSON data, and Requestly renders the result in the response **Body** area behind a **Visualize** button.
## rq.visualizer.set(template, data)
Sets the visualization for the current response. Requestly compiles the template as soon as you call `set()` and shows the result behind the **Visualize** button.
Available in **both pre-request and post-response scripts**.
**Parameters:**
* `template` (string, required): A [Handlebars](https://handlebarsjs.com/) template. It can contain HTML, `
| Name | Email |
|---|
{{#each users}}
| {{name}} | {{email}} |
{{/each}}
`;
rq.visualizer.set(template, { users: rq.response.json() });
```
Each call to `set()` replaces the previous visualization. If it runs more than once, including across a pre-request and a post-response script, the last call to run wins.
## Viewing the visualization
After a post-response script calls `rq.visualizer.set()`, a **Visualize** button appears beside the format selector in the response **Body** area. Send the request, then click **Visualize** to switch the body view to your rendered visualization.
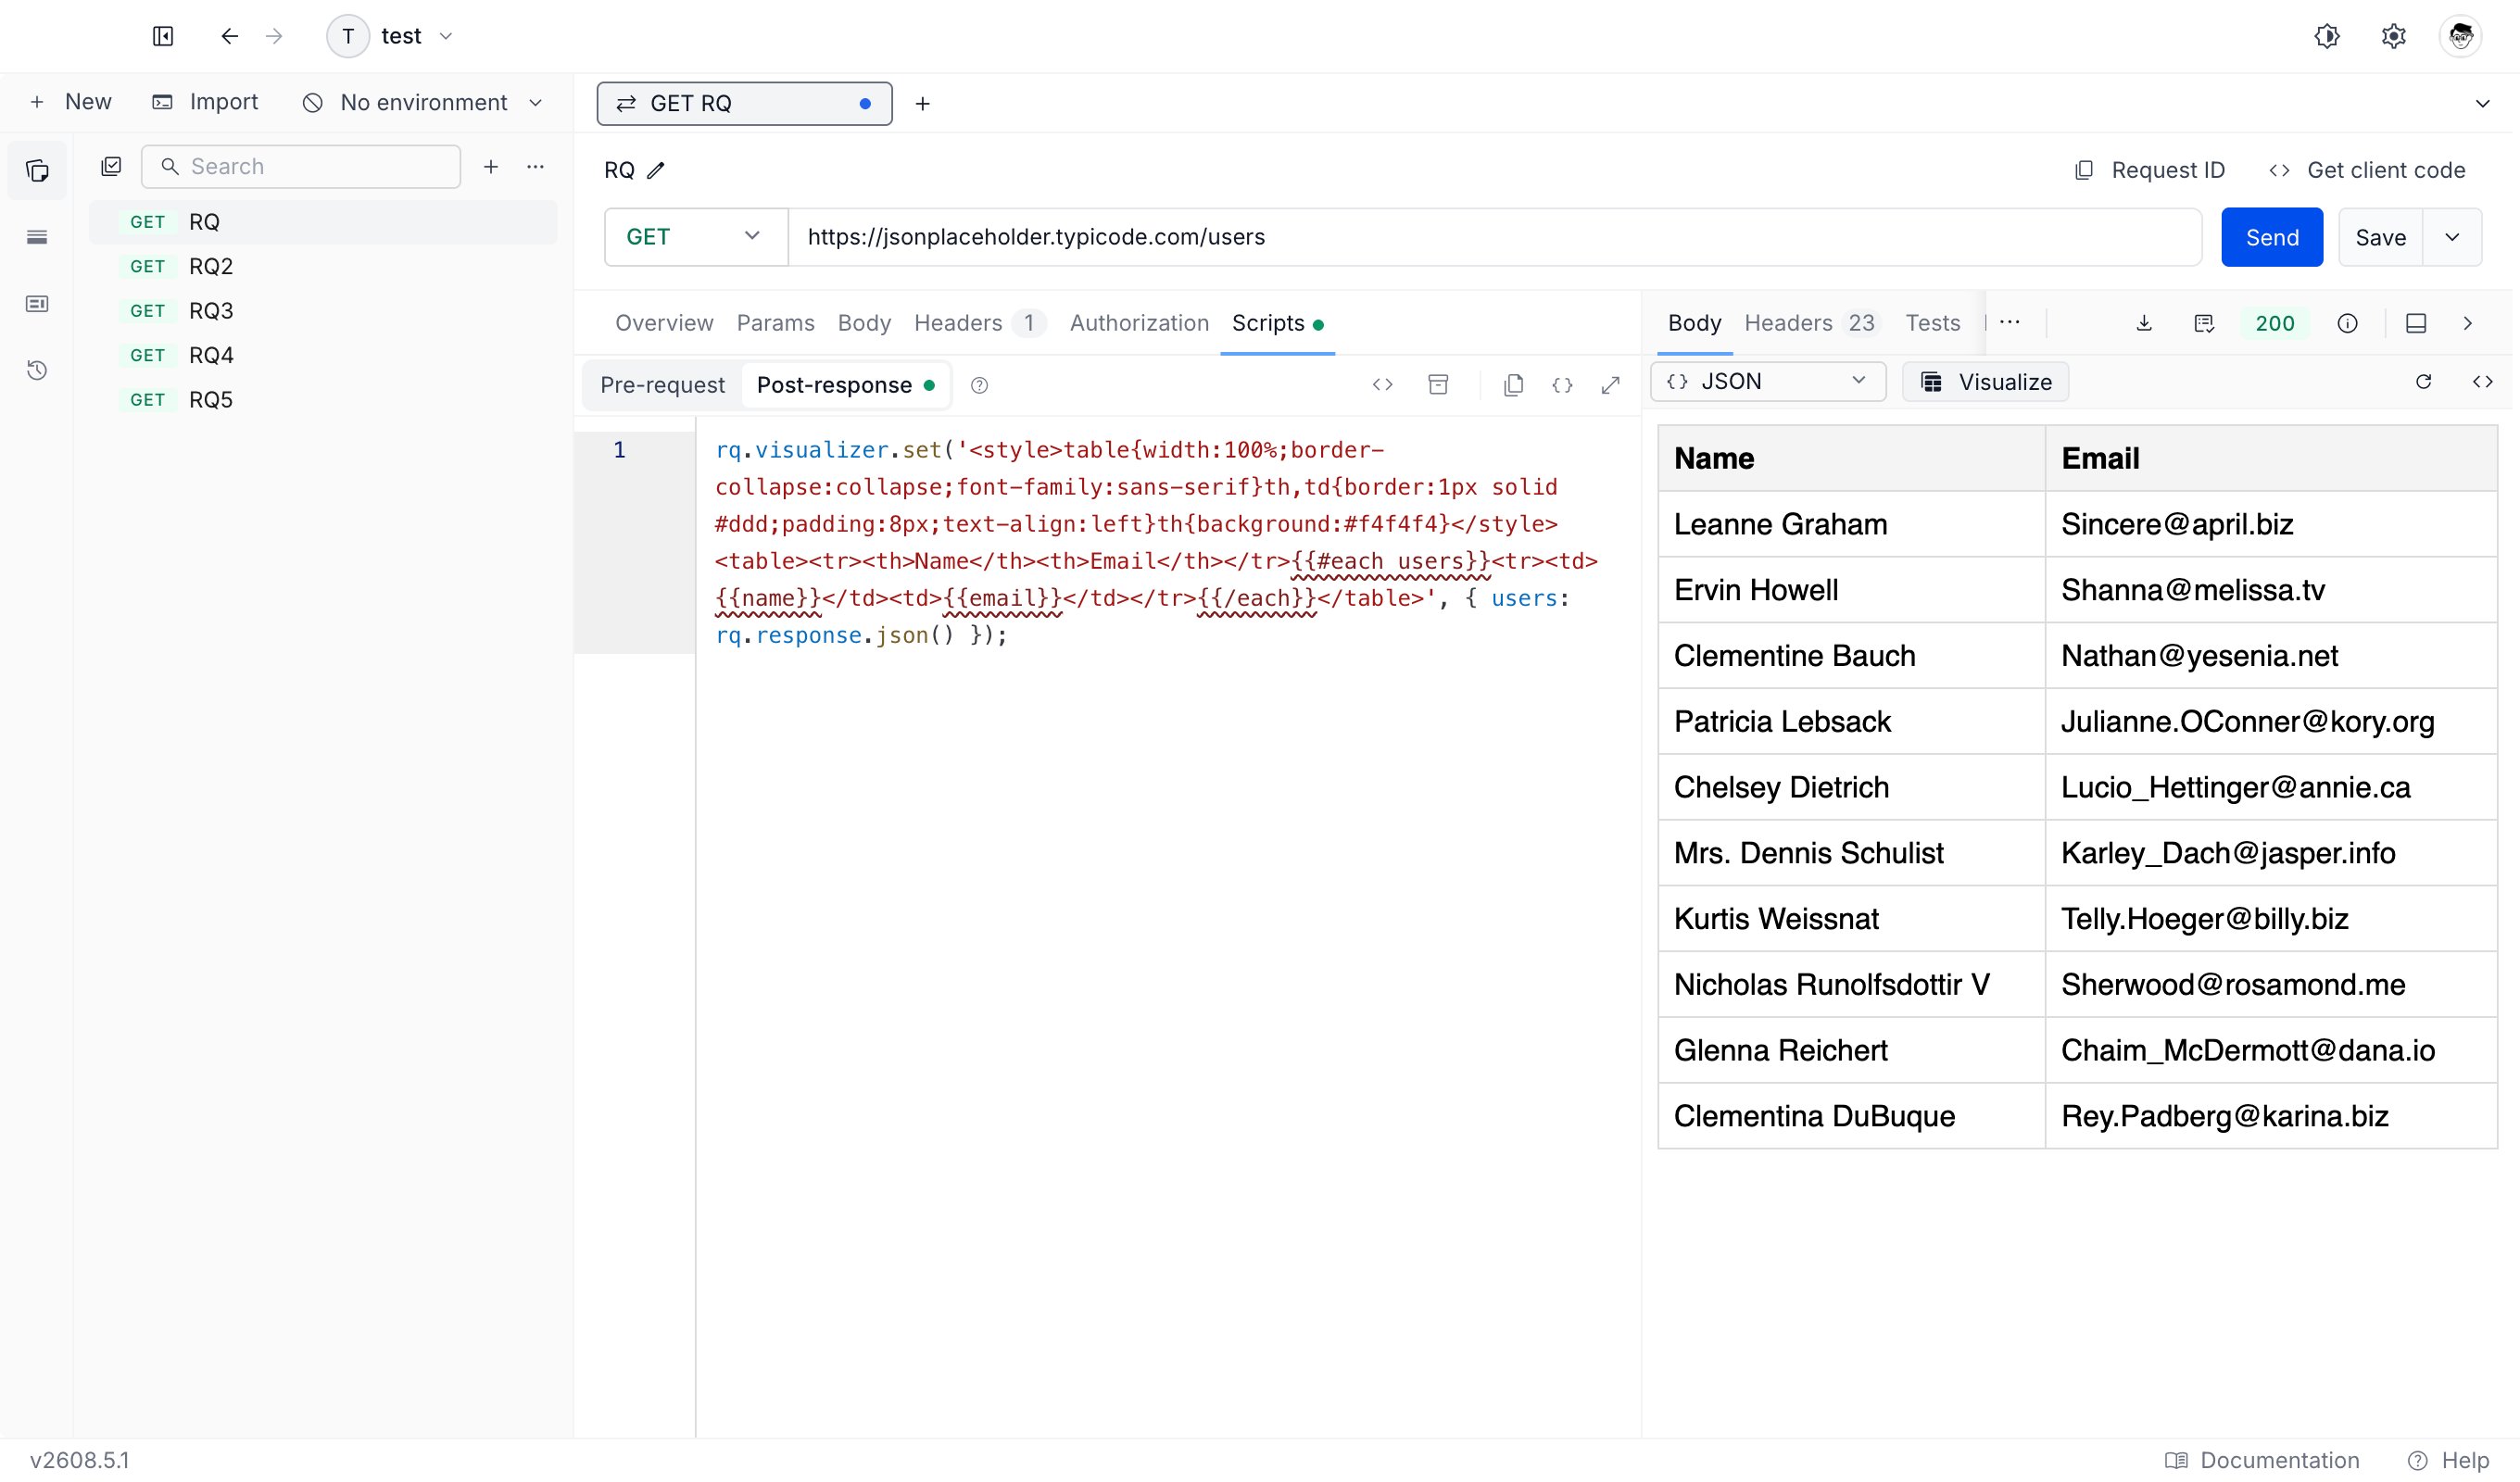
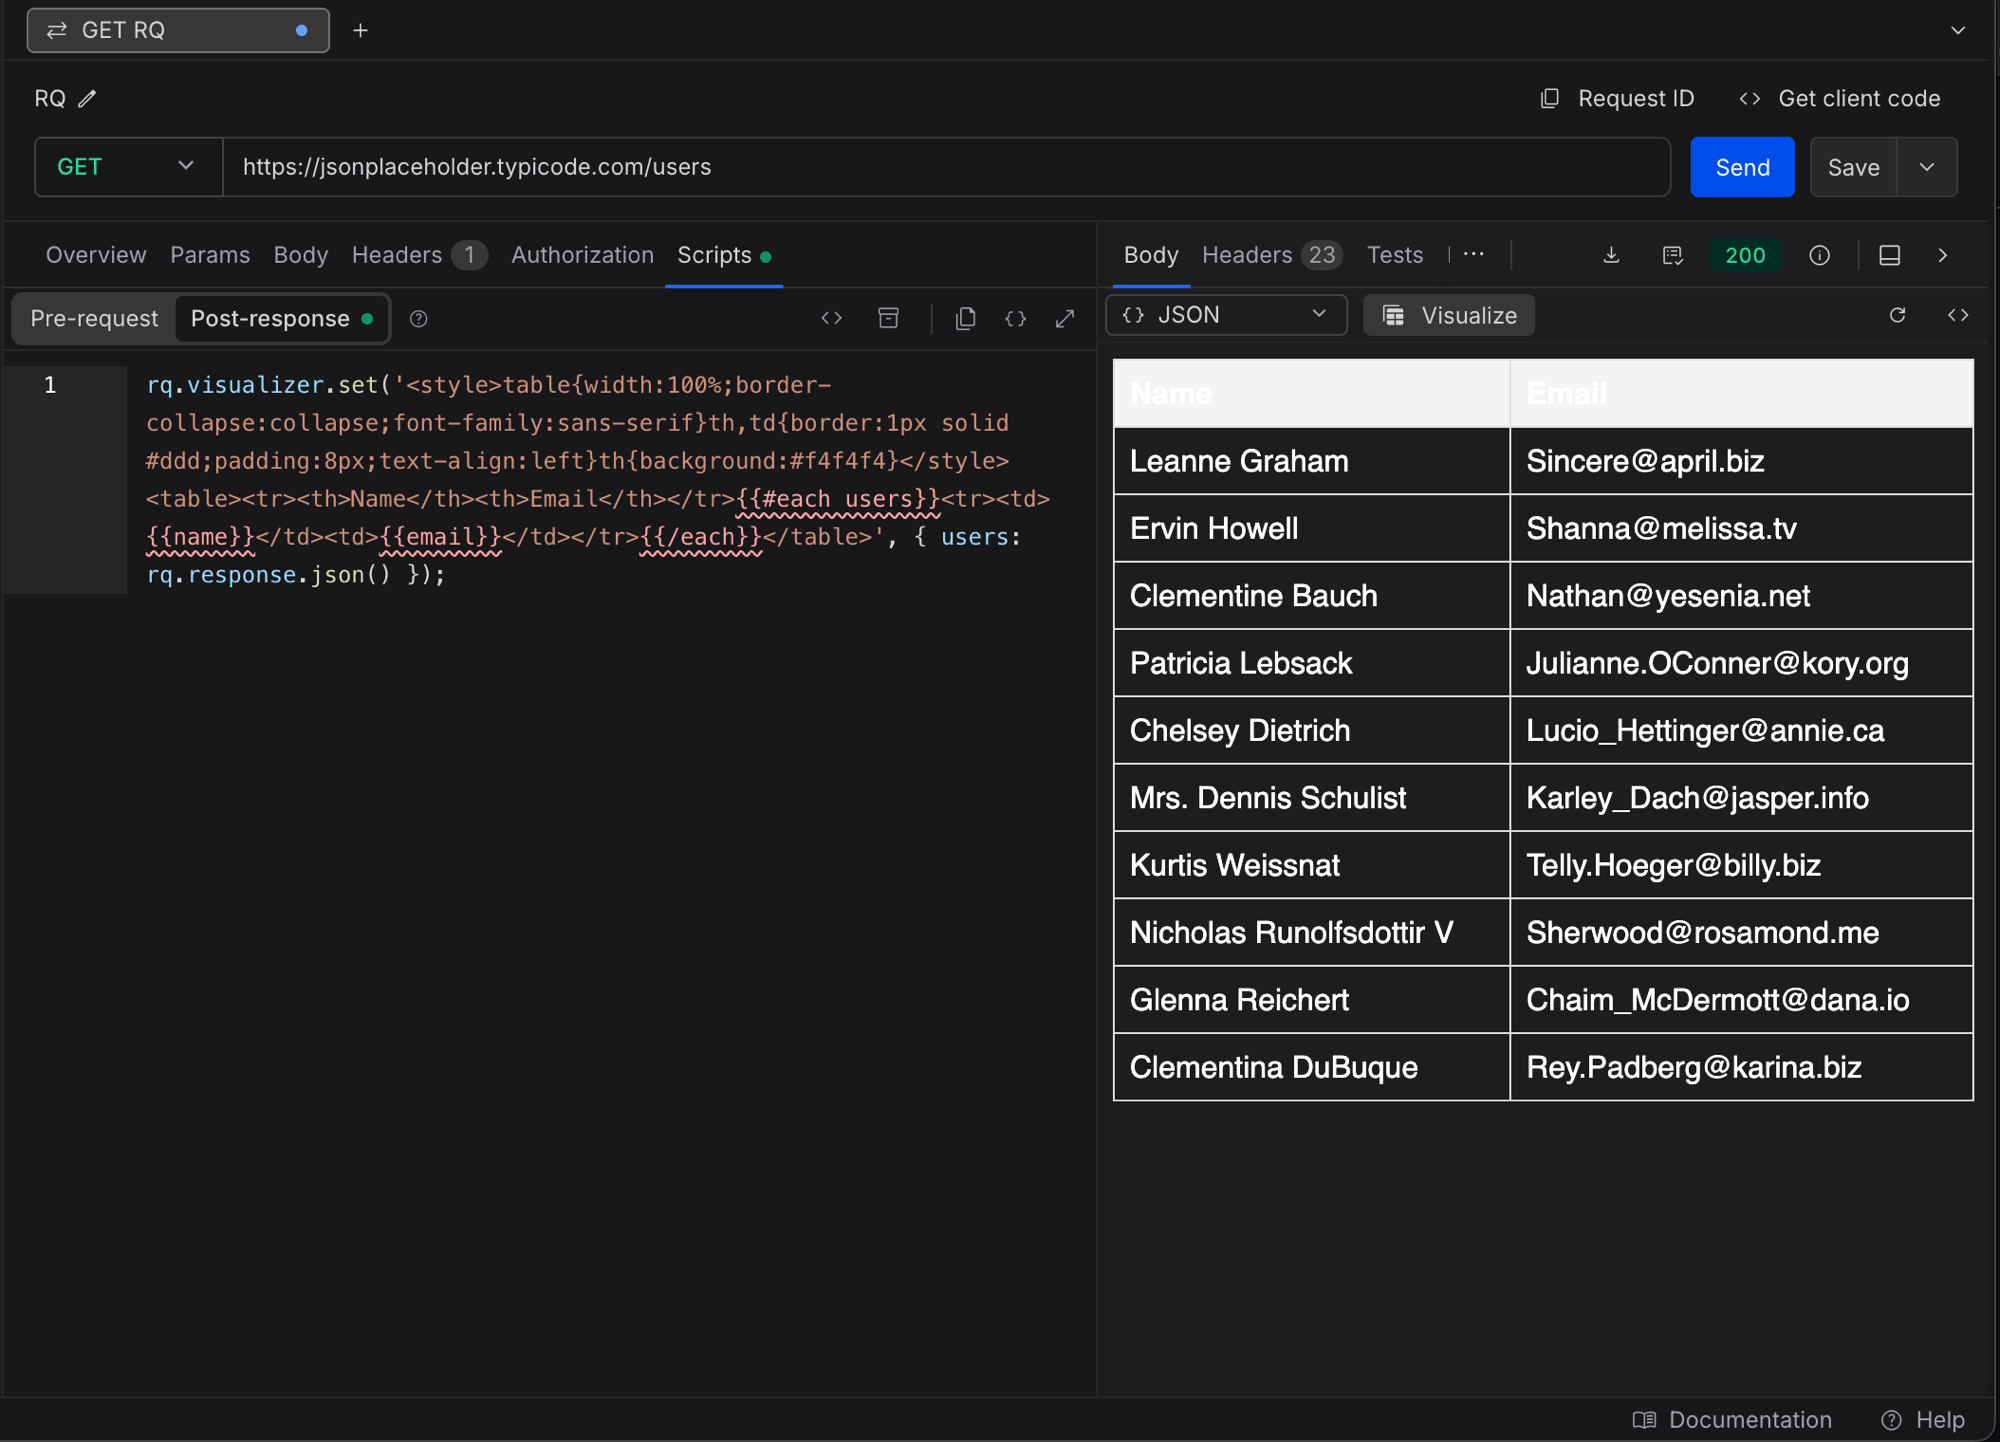 Until a script sets a visualization, the **Visualize** button stays disabled. Hover it to see how to turn it on.
When the visualization is showing, two more actions appear beside it:
* **Refresh** re-renders the current visualization without sending the request again. Use it to re-run a chart's animation or reload the visualization from its captured data.
* **View Script** opens the post-response **Scripts** tab, where your `rq.visualizer.set()` call lives.
Switching the format selector back to Raw, Hex, or Base64 returns the body to its normal view.
## Reading your data inside the visualization
There are two ways to get your `data` into the rendered output:
1. **Handlebars expressions.** Anything in `{{ ... }}` renders against the `data` you passed to `set()`. This is the simplest path for tables and text.
2. **`rq.getData`.** Call it inside a `
`;
rq.visualizer.set(template, {
labels: ["Mon", "Tue", "Wed"],
values: [12, 19, 7],
});
```
## rq.visualizer.clear()
Removes the current visualization and returns the **Visualize** button to its disabled state. Use it to hide a stale visualization when the response does not warrant one.
**Parameters:** none.
```jsx theme={null}
// Post-response script
if (rq.response.code !== 200) {
rq.visualizer.clear();
}
```
## How the visualization is isolated
Your visualization runs in a sandboxed frame that is separated from the rest of Requestly. Inside it you can load scripts from a CDN and use inline event handlers, but the frame cannot read or change the app around it, your cookies, or your other data. If a CDN script fails to load, the failure stays contained in the frame and does not affect Requestly.
## When something goes wrong
If your template cannot be compiled (for example a Handlebars syntax error), or your `data` cannot be turned into JSON (for example it contains a circular reference or a `BigInt`), Requestly shows a short **Template error** message in place of the visualization instead of a blank body. A **View Script** button sits next to the message so you can jump straight to the script and fix it.
## Using Postman visualizer scripts
If you import a Postman collection whose scripts call `pm.visualizer.set()`, Requestly translates them to `rq.visualizer.set()` automatically, so your visualizations work without editing the script. Inside the visualization, `pm.getData` works alongside `rq.getData`, so Postman visualization templates render unchanged.
## Related Documentation
* [Pre-request & Post-response Scripts](/api-client/scripts)
* [Scripts Reference Overview](/api-client/rq-api-reference/overview)
* [rq.response Object](/api-client/rq-api-reference/rq-response)
* [rq.test Object](/api-client/rq-api-reference/rq-test)
* [Import from Postman](/api-client/import-export/import-from-postman)
Until a script sets a visualization, the **Visualize** button stays disabled. Hover it to see how to turn it on.
When the visualization is showing, two more actions appear beside it:
* **Refresh** re-renders the current visualization without sending the request again. Use it to re-run a chart's animation or reload the visualization from its captured data.
* **View Script** opens the post-response **Scripts** tab, where your `rq.visualizer.set()` call lives.
Switching the format selector back to Raw, Hex, or Base64 returns the body to its normal view.
## Reading your data inside the visualization
There are two ways to get your `data` into the rendered output:
1. **Handlebars expressions.** Anything in `{{ ... }}` renders against the `data` you passed to `set()`. This is the simplest path for tables and text.
2. **`rq.getData`.** Call it inside a `
`;
rq.visualizer.set(template, {
labels: ["Mon", "Tue", "Wed"],
values: [12, 19, 7],
});
```
## rq.visualizer.clear()
Removes the current visualization and returns the **Visualize** button to its disabled state. Use it to hide a stale visualization when the response does not warrant one.
**Parameters:** none.
```jsx theme={null}
// Post-response script
if (rq.response.code !== 200) {
rq.visualizer.clear();
}
```
## How the visualization is isolated
Your visualization runs in a sandboxed frame that is separated from the rest of Requestly. Inside it you can load scripts from a CDN and use inline event handlers, but the frame cannot read or change the app around it, your cookies, or your other data. If a CDN script fails to load, the failure stays contained in the frame and does not affect Requestly.
## When something goes wrong
If your template cannot be compiled (for example a Handlebars syntax error), or your `data` cannot be turned into JSON (for example it contains a circular reference or a `BigInt`), Requestly shows a short **Template error** message in place of the visualization instead of a blank body. A **View Script** button sits next to the message so you can jump straight to the script and fix it.
## Using Postman visualizer scripts
If you import a Postman collection whose scripts call `pm.visualizer.set()`, Requestly translates them to `rq.visualizer.set()` automatically, so your visualizations work without editing the script. Inside the visualization, `pm.getData` works alongside `rq.getData`, so Postman visualization templates render unchanged.
## Related Documentation
* [Pre-request & Post-response Scripts](/api-client/scripts)
* [Scripts Reference Overview](/api-client/rq-api-reference/overview)
* [rq.response Object](/api-client/rq-api-reference/rq-response)
* [rq.test Object](/api-client/rq-api-reference/rq-test)
* [Import from Postman](/api-client/import-export/import-from-postman)