

rq.visualizer namespace lets your scripts render a custom view of your response: a chart, a table, or any formatted HTML, shown right beside the raw body. You give it a Handlebars template and some JSON data, and Requestly renders the result in the response Body area behind a Visualize button.
rq.visualizer.set(template, data)
Sets the visualization for the current response. Requestly compiles the template as soon as you callset() and shows the result behind the Visualize button.
Available in both pre-request and post-response scripts.
Parameters:
template(string, required): A Handlebars template. It can contain HTML,<style>, inline event handlers, and<script>tags, including a<script src="...">that loads a library from a CDN (for example Chart.js).data(JSON, optional): Any JSON-serializable value. Handlebars expressions such as{{name}}in the template render against it, andrq.getDatainside the visualization reads it back at runtime.
Each call to
set() replaces the previous visualization. If it runs more than once, including across a pre-request and a post-response script, the last call to run wins.Viewing the visualization
After a post-response script callsrq.visualizer.set(), a Visualize button appears beside the format selector in the response Body area. Send the request, then click Visualize to switch the body view to your rendered visualization.
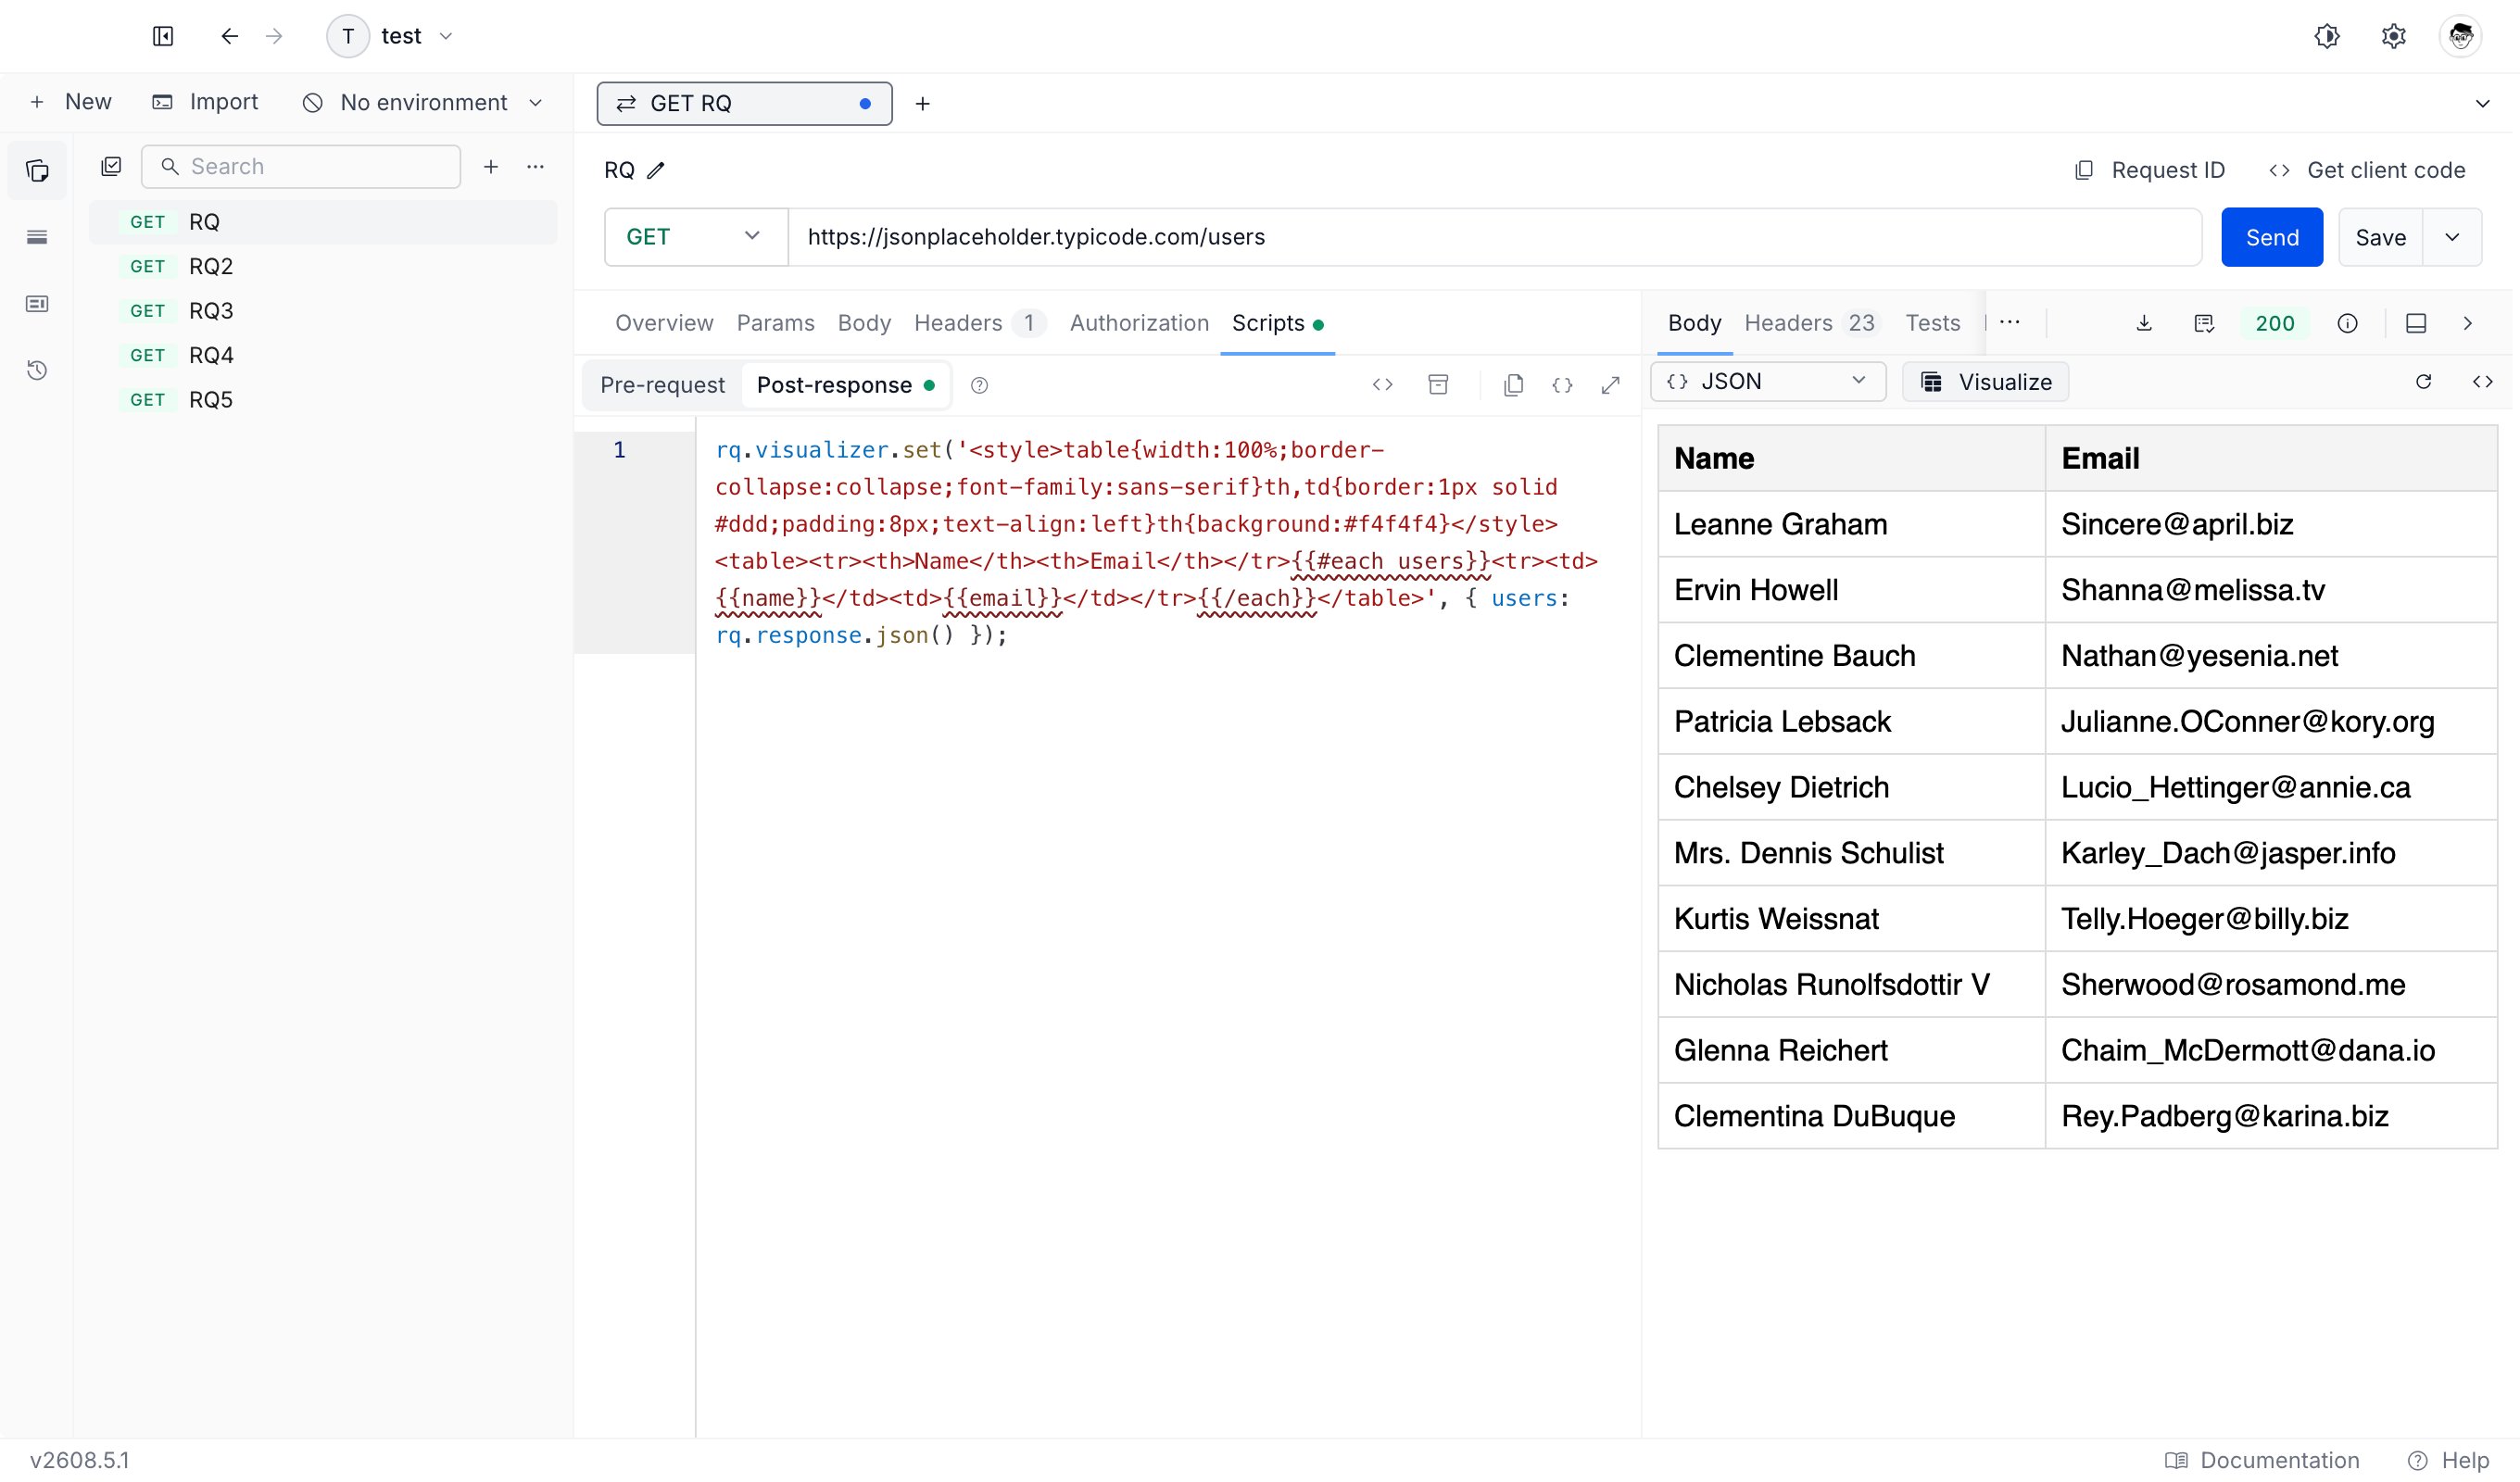
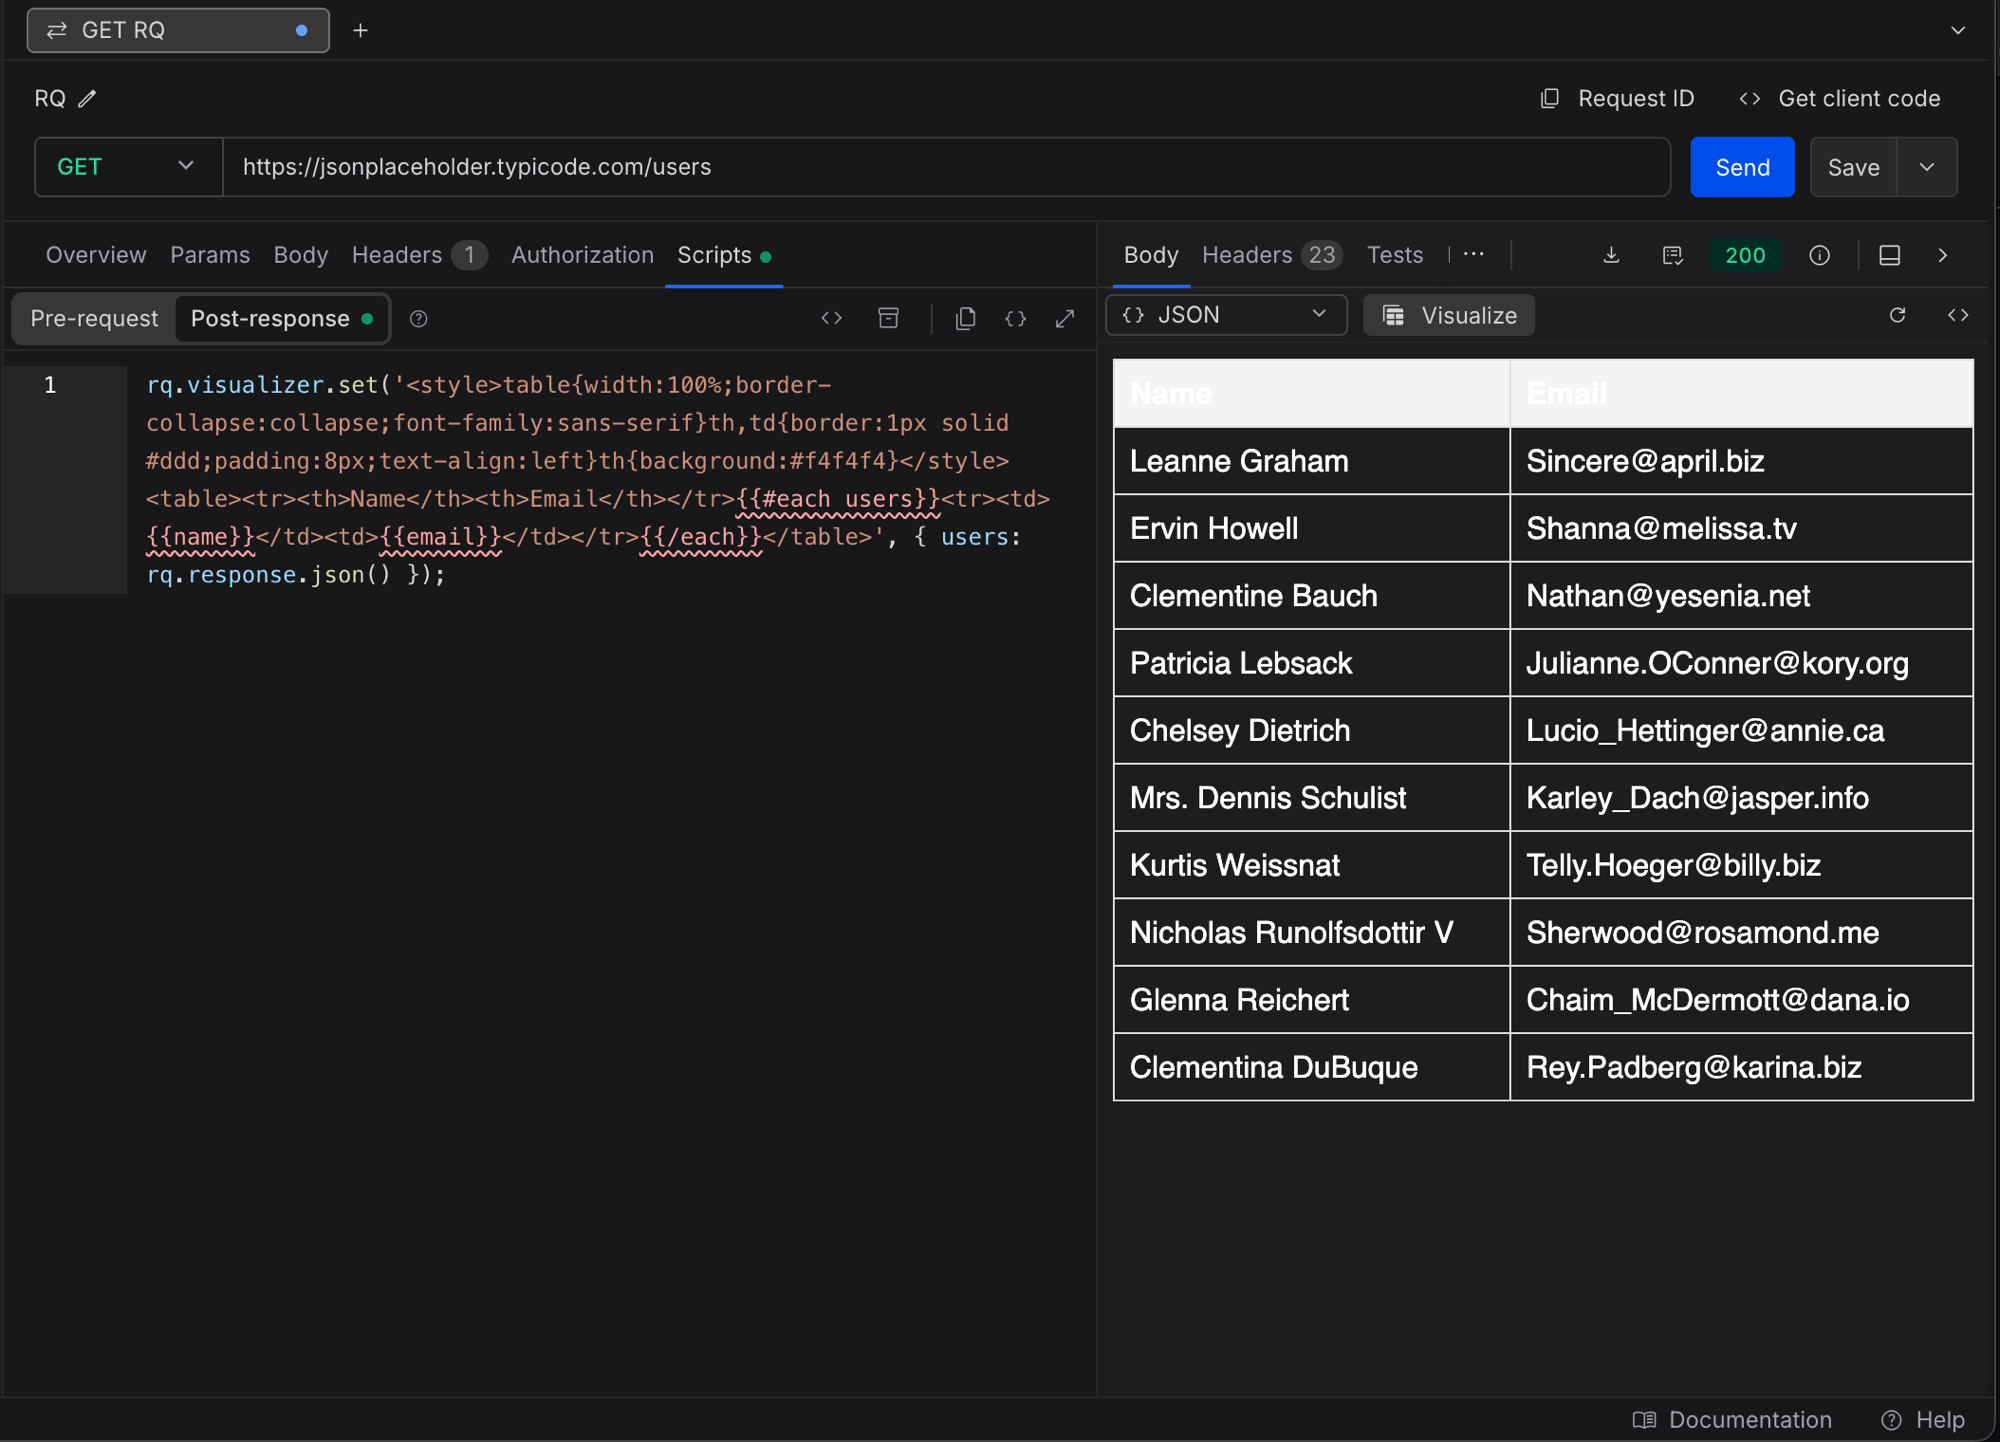
- Refresh re-renders the current visualization without sending the request again. Use it to re-run a chart’s animation or reload the visualization from its captured data.
- View Script opens the post-response Scripts tab, where your
rq.visualizer.set()call lives.
Reading your data inside the visualization
There are two ways to get yourdata into the rendered output:
- Handlebars expressions. Anything in
{{ ... }}renders against thedatayou passed toset(). This is the simplest path for tables and text. rq.getData. Call it inside a<script>to read the samedataback as a JavaScript object. This is the path for charts and other libraries that build the DOM themselves.
rq.getData takes a callback with the Node-style (error, data) signature:
rq.visualizer.clear()
Removes the current visualization and returns the Visualize button to its disabled state. Use it to hide a stale visualization when the response does not warrant one. Parameters: none.How the visualization is isolated
Your visualization runs in a sandboxed frame that is separated from the rest of Requestly. Inside it you can load scripts from a CDN and use inline event handlers, but the frame cannot read or change the app around it, your cookies, or your other data. If a CDN script fails to load, the failure stays contained in the frame and does not affect Requestly.When something goes wrong
If your template cannot be compiled (for example a Handlebars syntax error), or yourdata cannot be turned into JSON (for example it contains a circular reference or a BigInt), Requestly shows a short Template error message in place of the visualization instead of a blank body. A View Script button sits next to the message so you can jump straight to the script and fix it.
Using Postman visualizer scripts
If you import a Postman collection whose scripts callpm.visualizer.set(), Requestly translates them to rq.visualizer.set() automatically, so your visualizations work without editing the script. Inside the visualization, pm.getData works alongside rq.getData, so Postman visualization templates render unchanged.