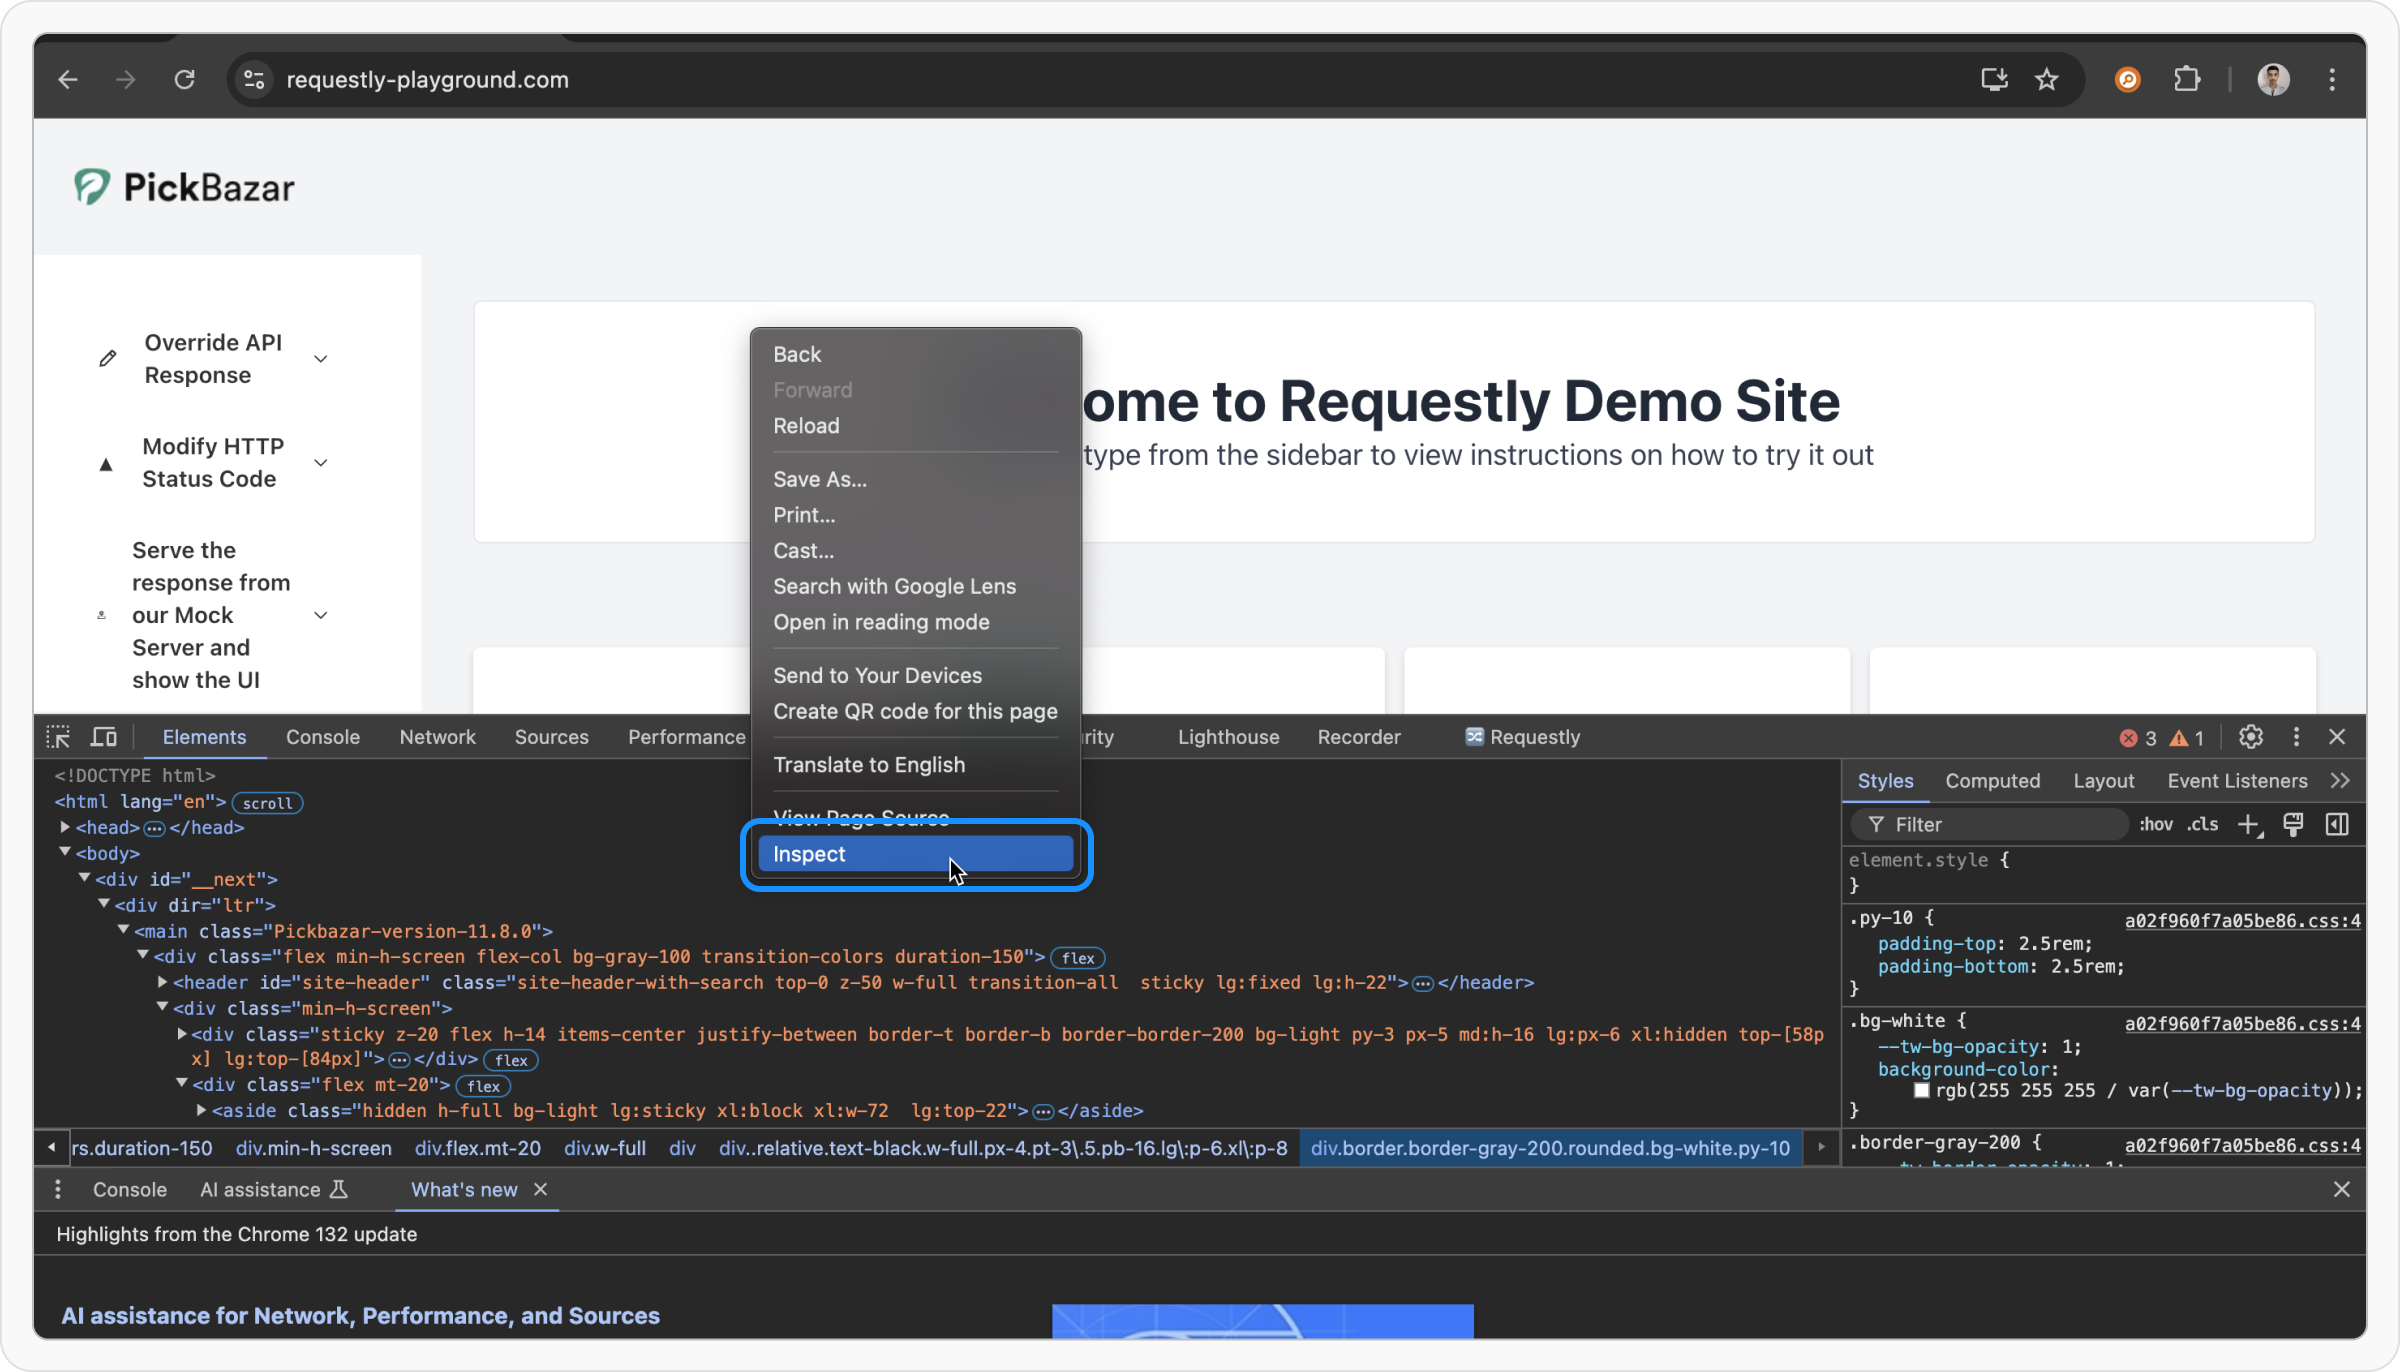
Steps to Intercept traffic in Browser DevTools
Once open, this tab will list out all the requests made by your browser. Here, you have two tabs:
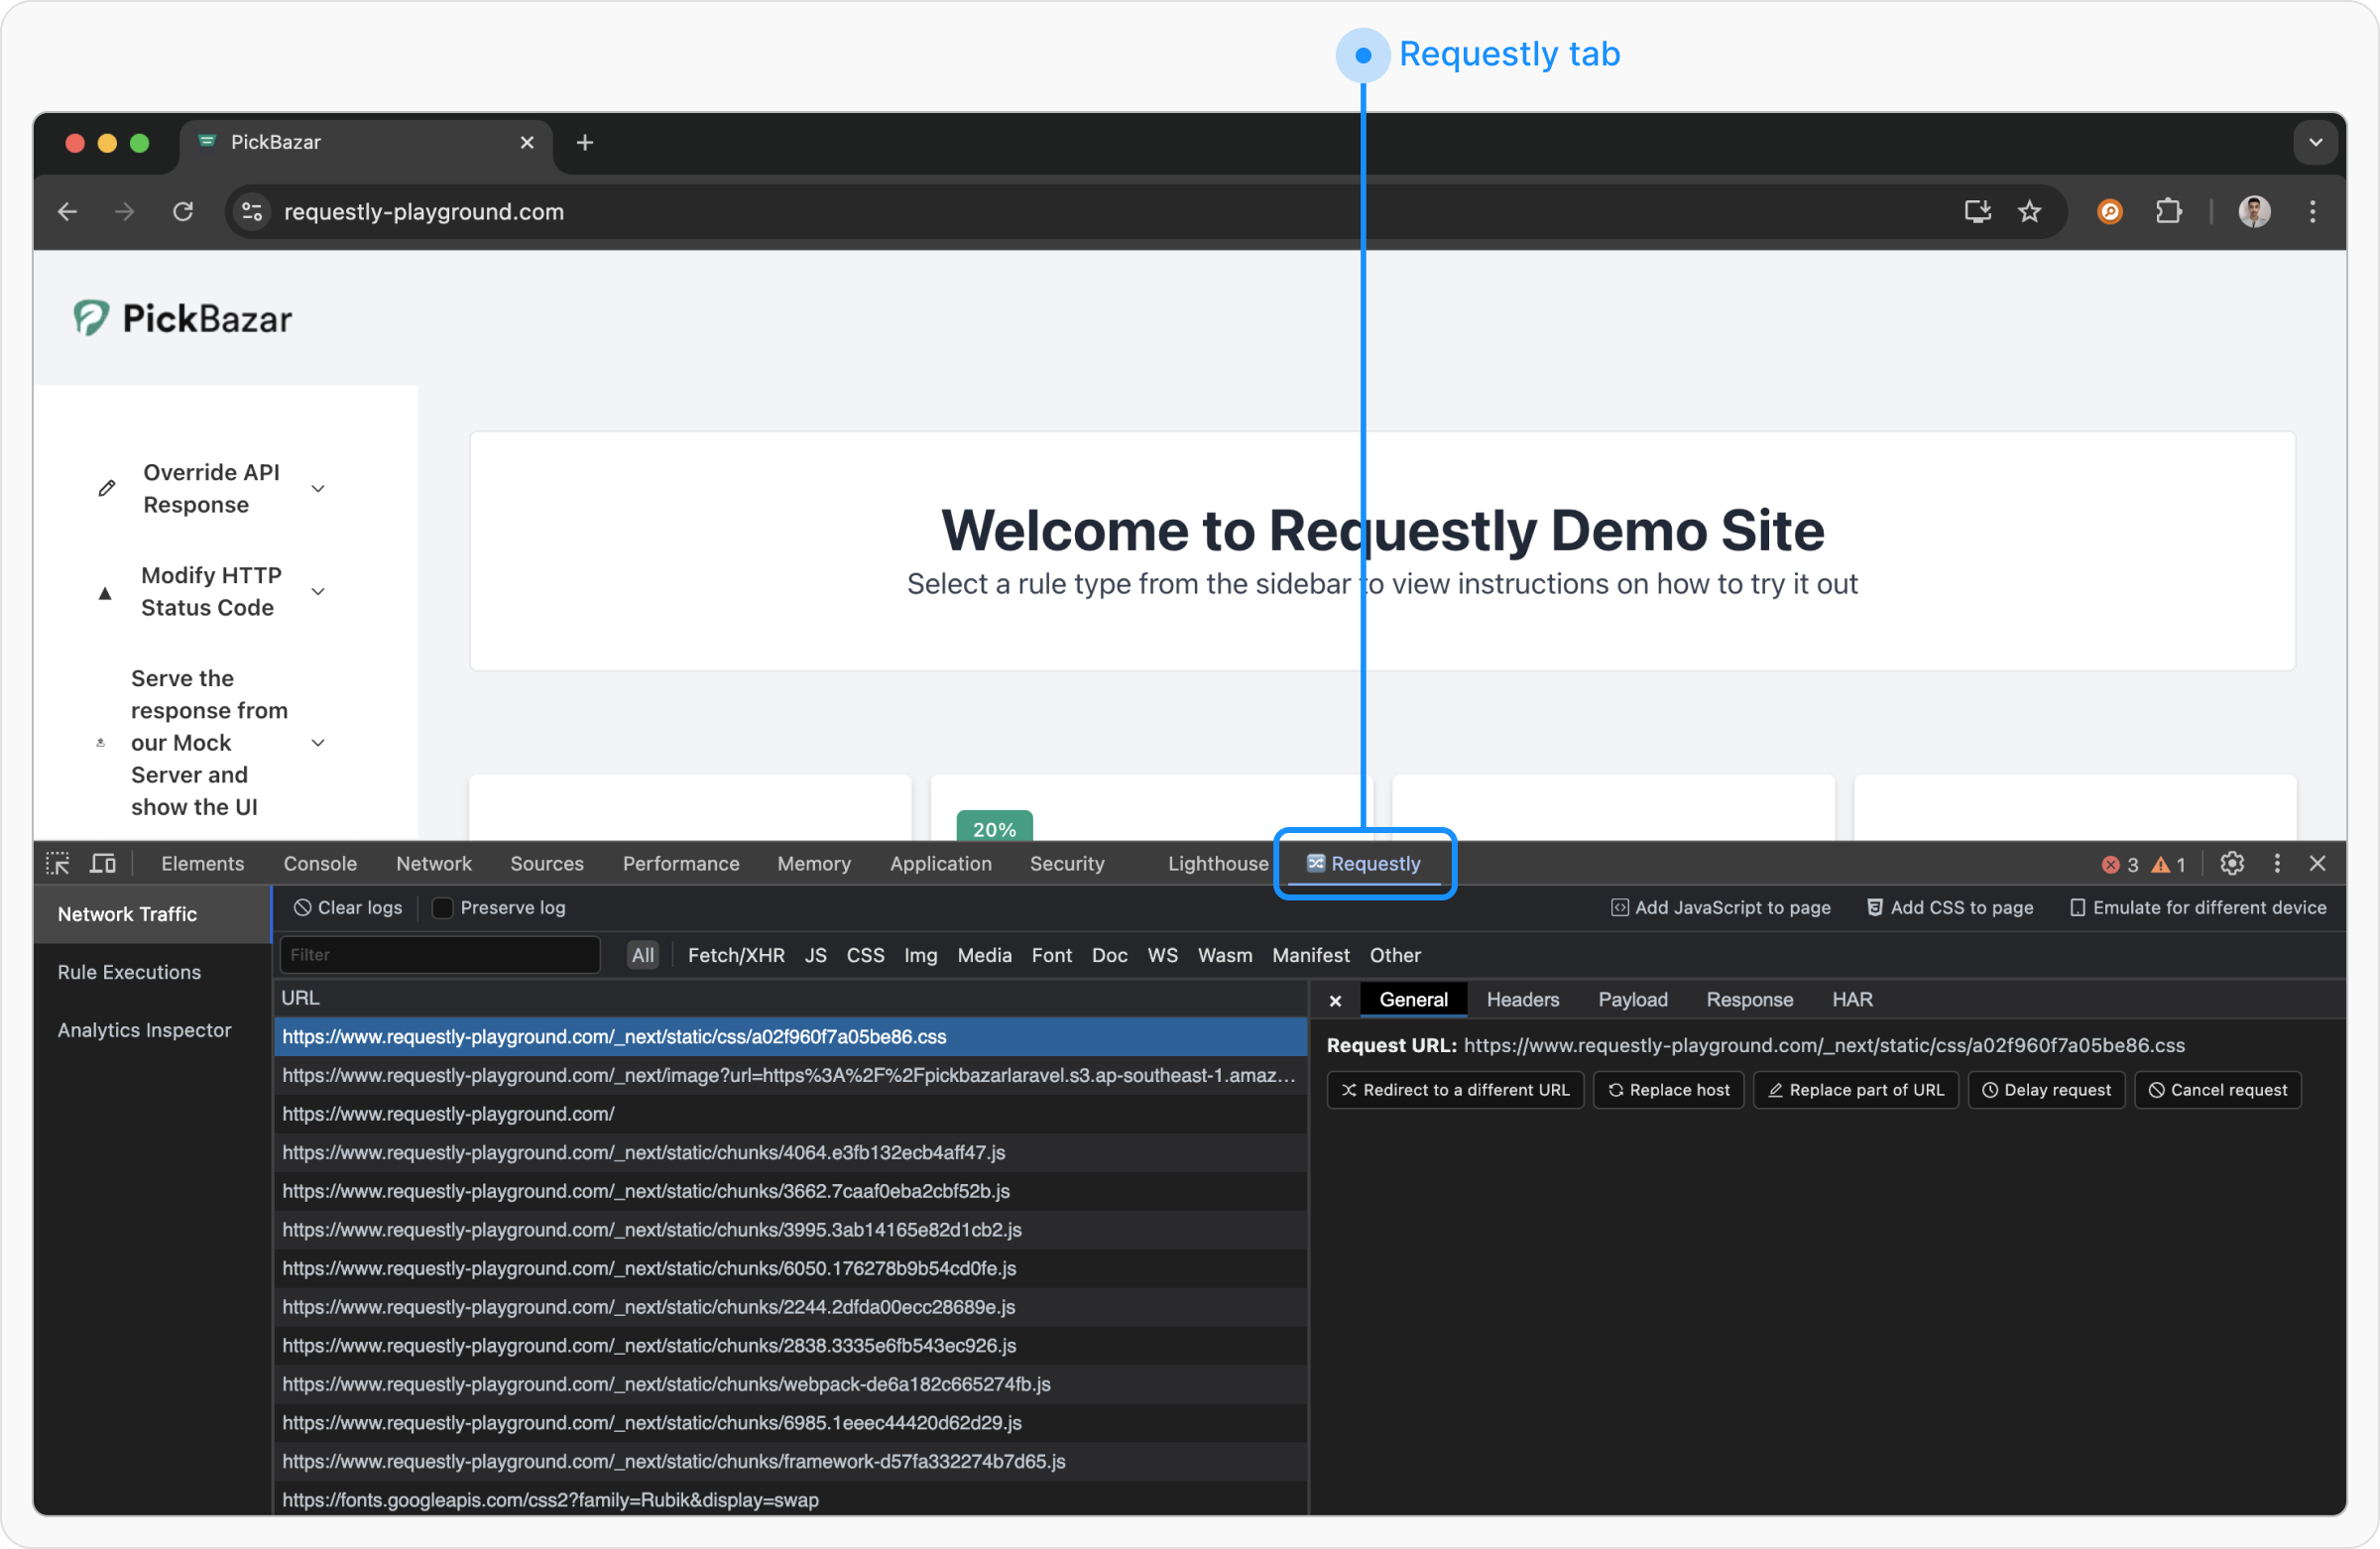
- Network Traffic
- Network Traffic
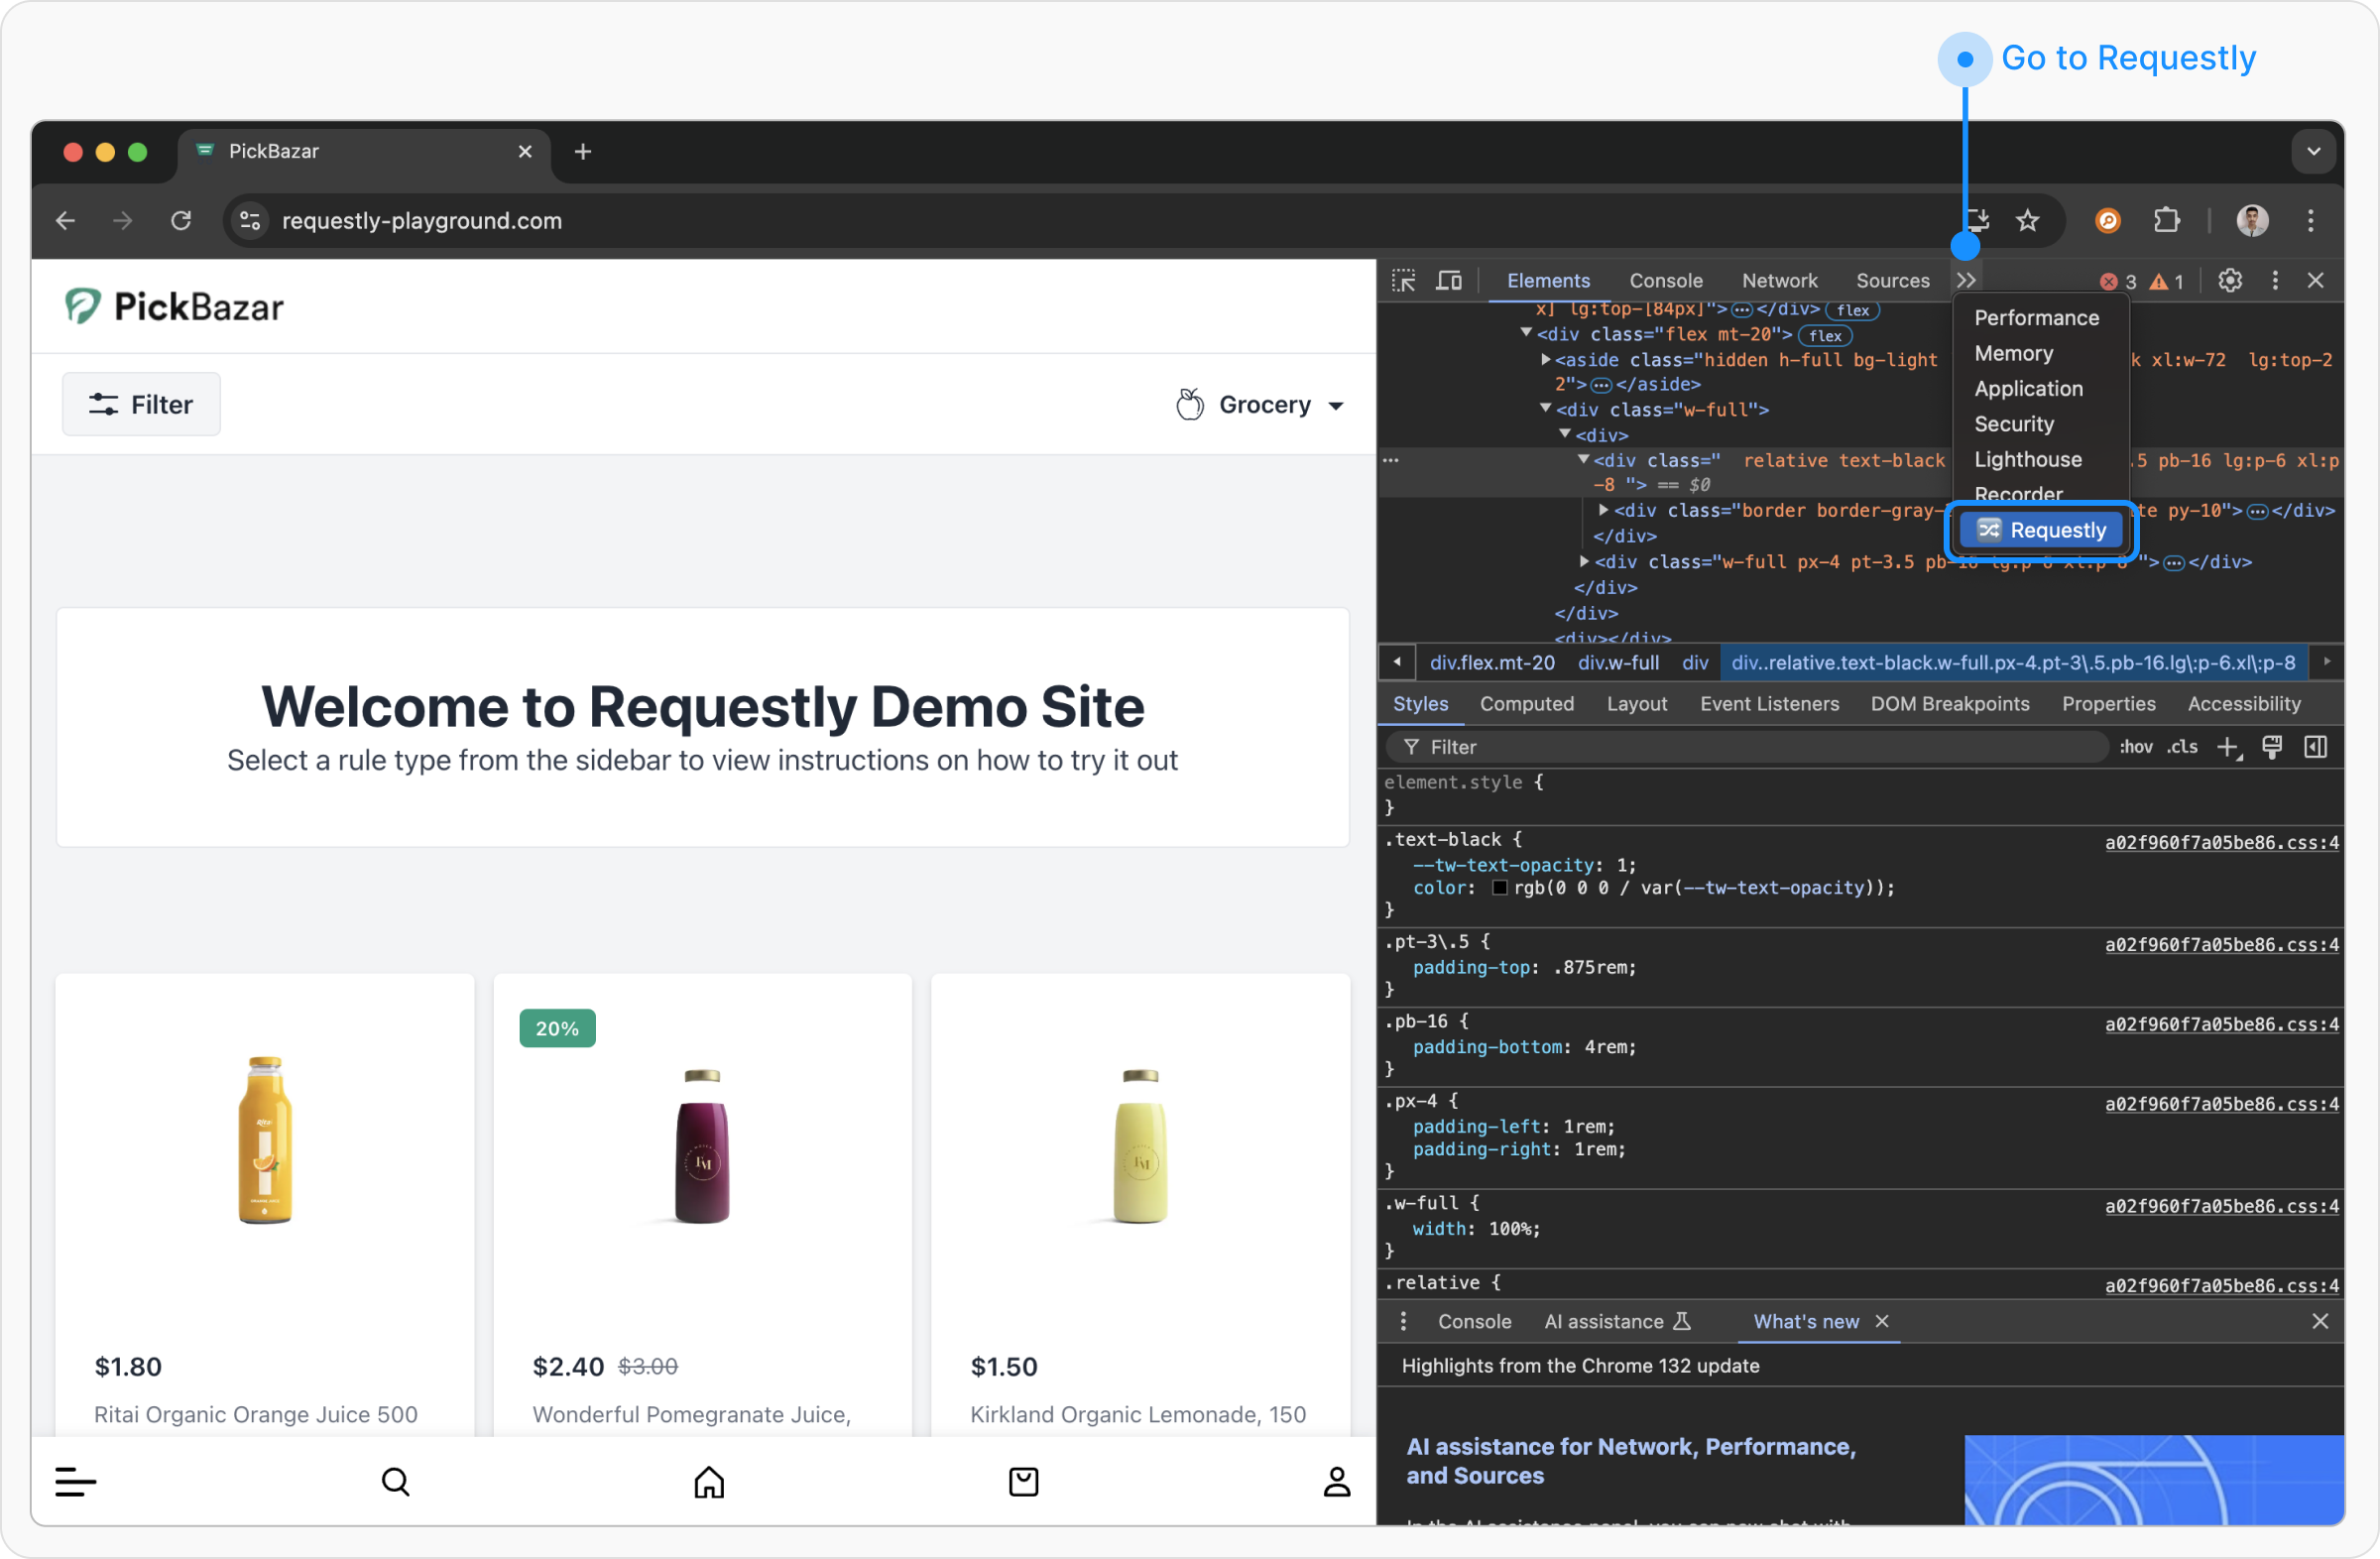
If you want to intercept traffic from another browser extension, please use the Requestly Desktop App instead.
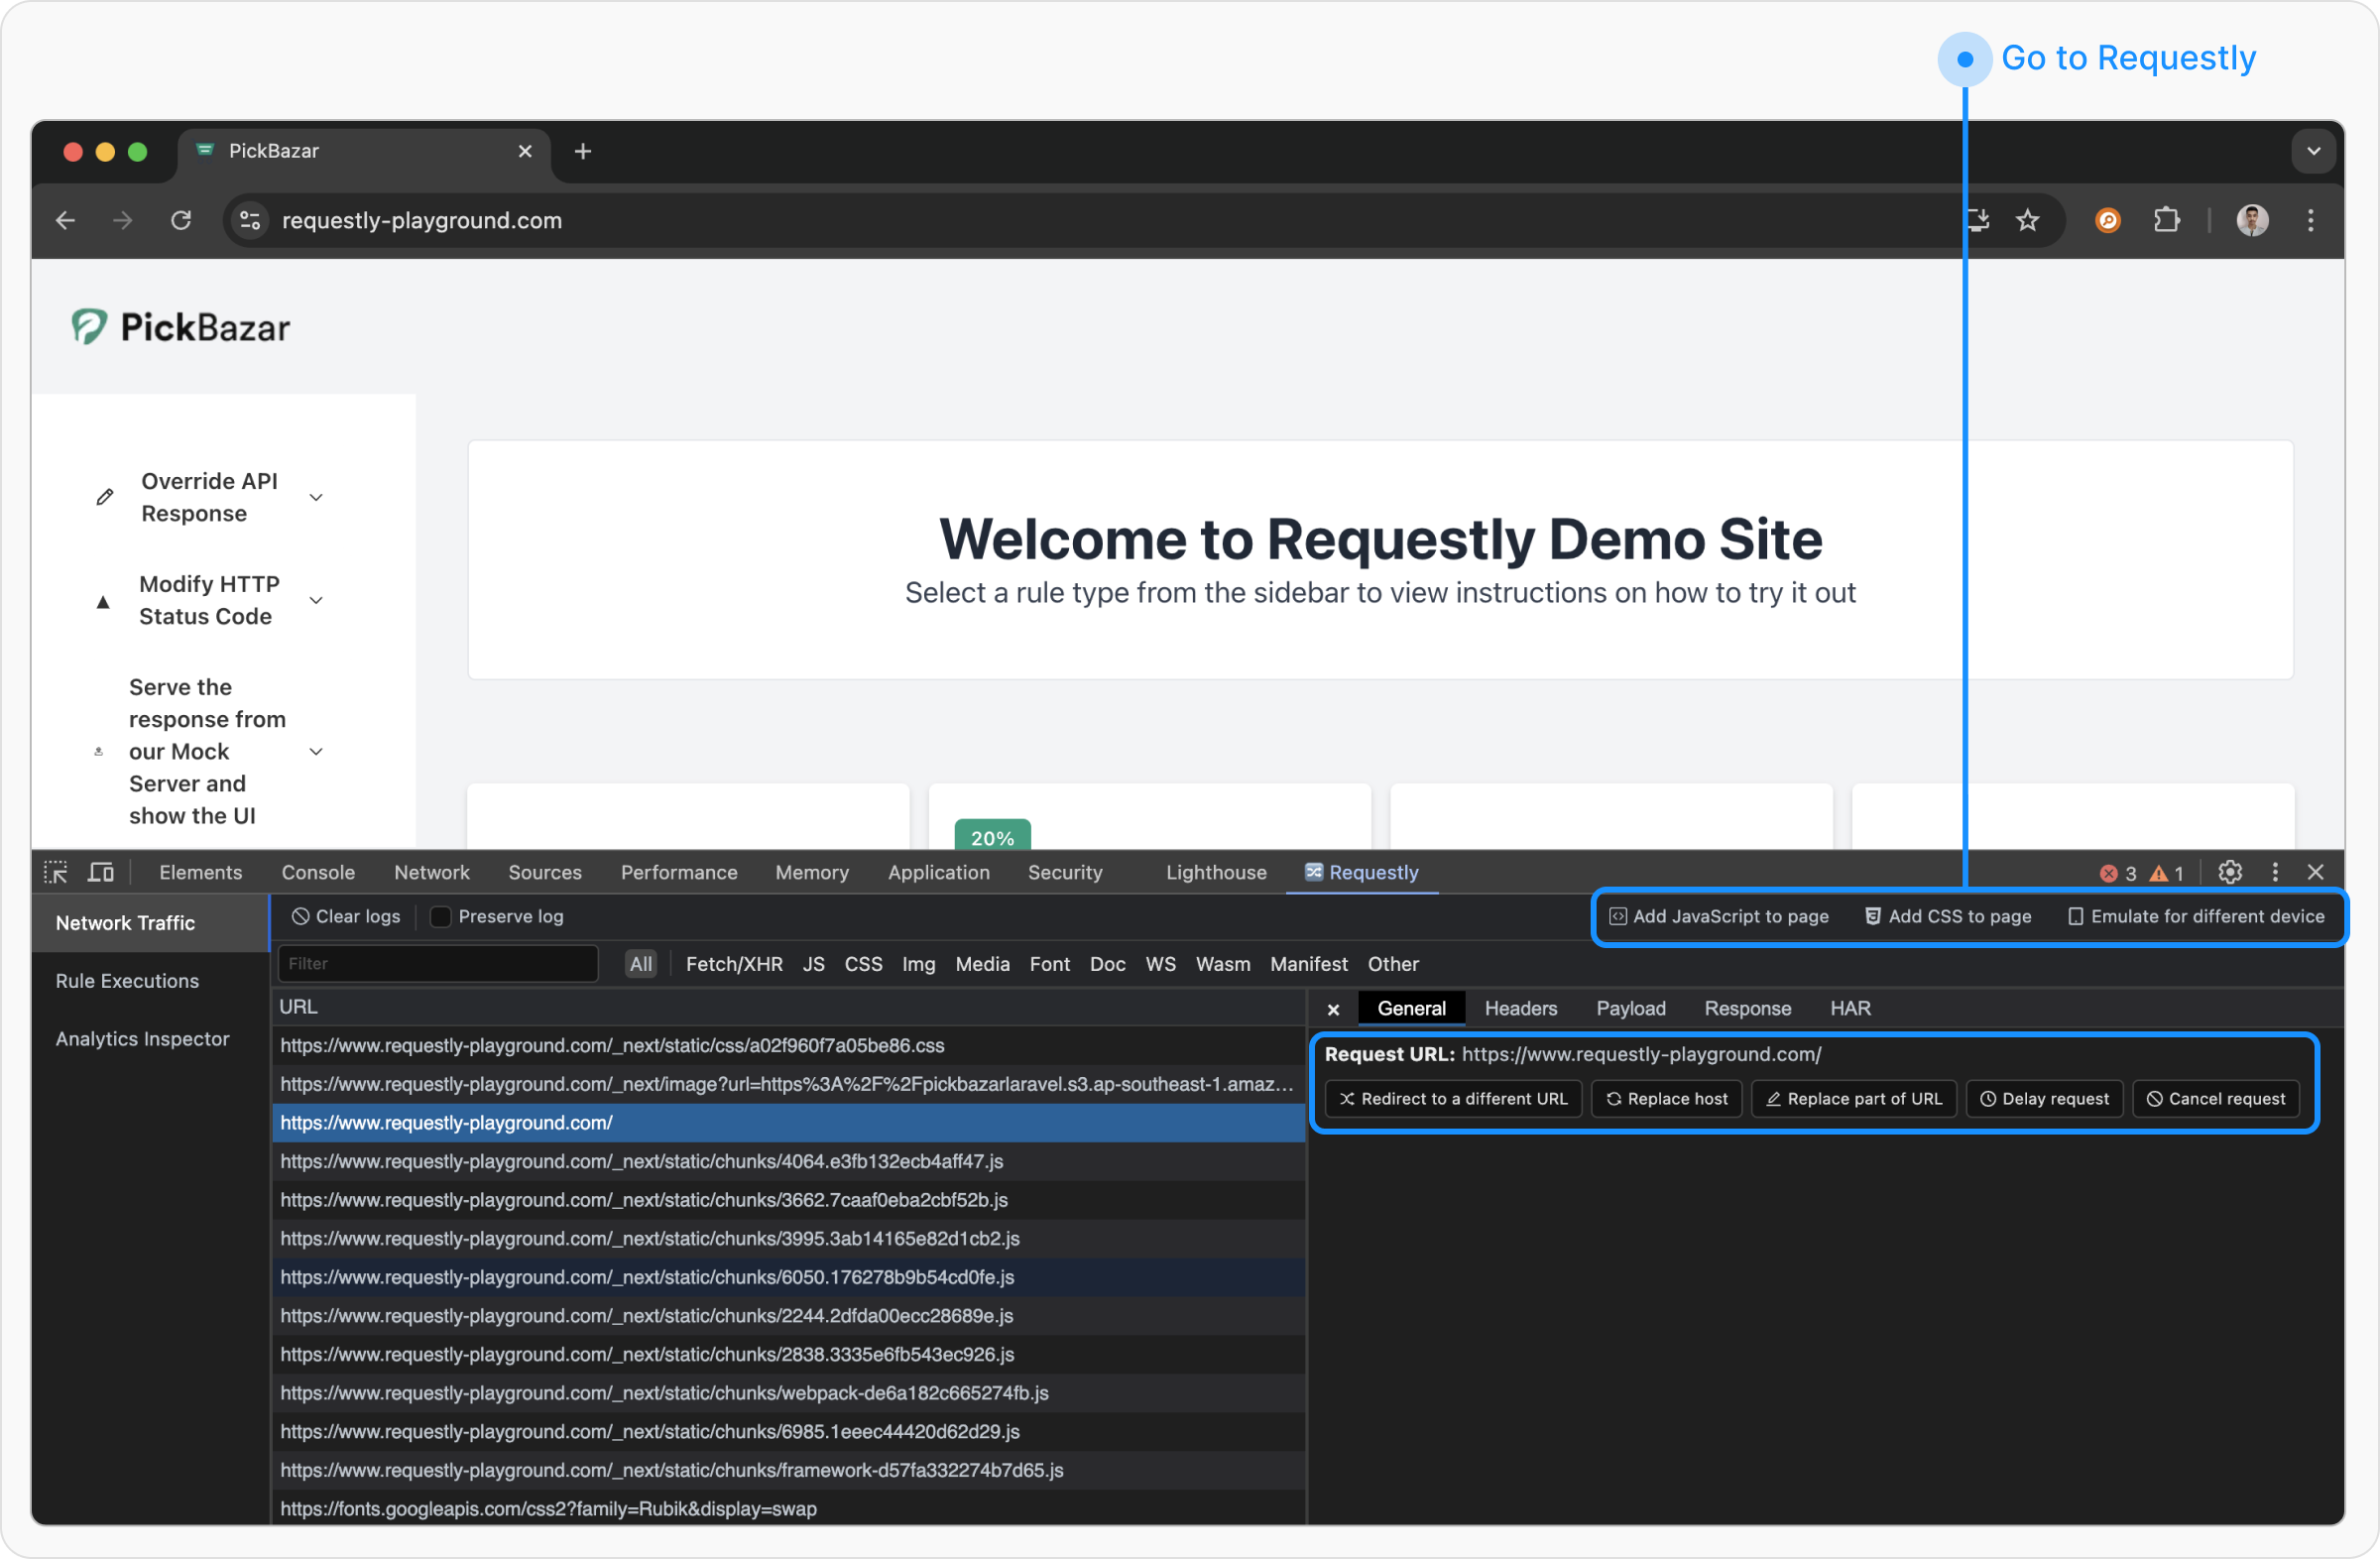
- Add JavaScript to Page: Injects custom JavaScript into the webpage.
- Add CSS to Page: Applies custom styles to the page.
- Emulate a Different Device: Simulates how the page renders on different devices.
- Redirect to Another URL
- Replace Host
- Replace Part of URL
- Delay Request
- Cancel Request